Search analytics
On this page
Search analytics offer insights into what your users search and which results they select through metrics such as popular searches, no results, and click-through rates.
Search analytics in the Algolia dashboard
To access your search analytics in the Algolia dashboard:
- Go to the Algolia dashboard and select your Algolia application.
- On the left sidebar, select Search.
-
Select your Algolia index:

- Go to Analytics.
- If you want to include analytics from other indices (including replicas), select Include other indices.
- If you want to segment the analytics by tags, click Toggle Analytics Tags. Select or enter a tag for filtering.
Access to the Analytics REST API is available as part of the Premium plan or as the Enterprise add-on to other pricing plans.
Comparison mode
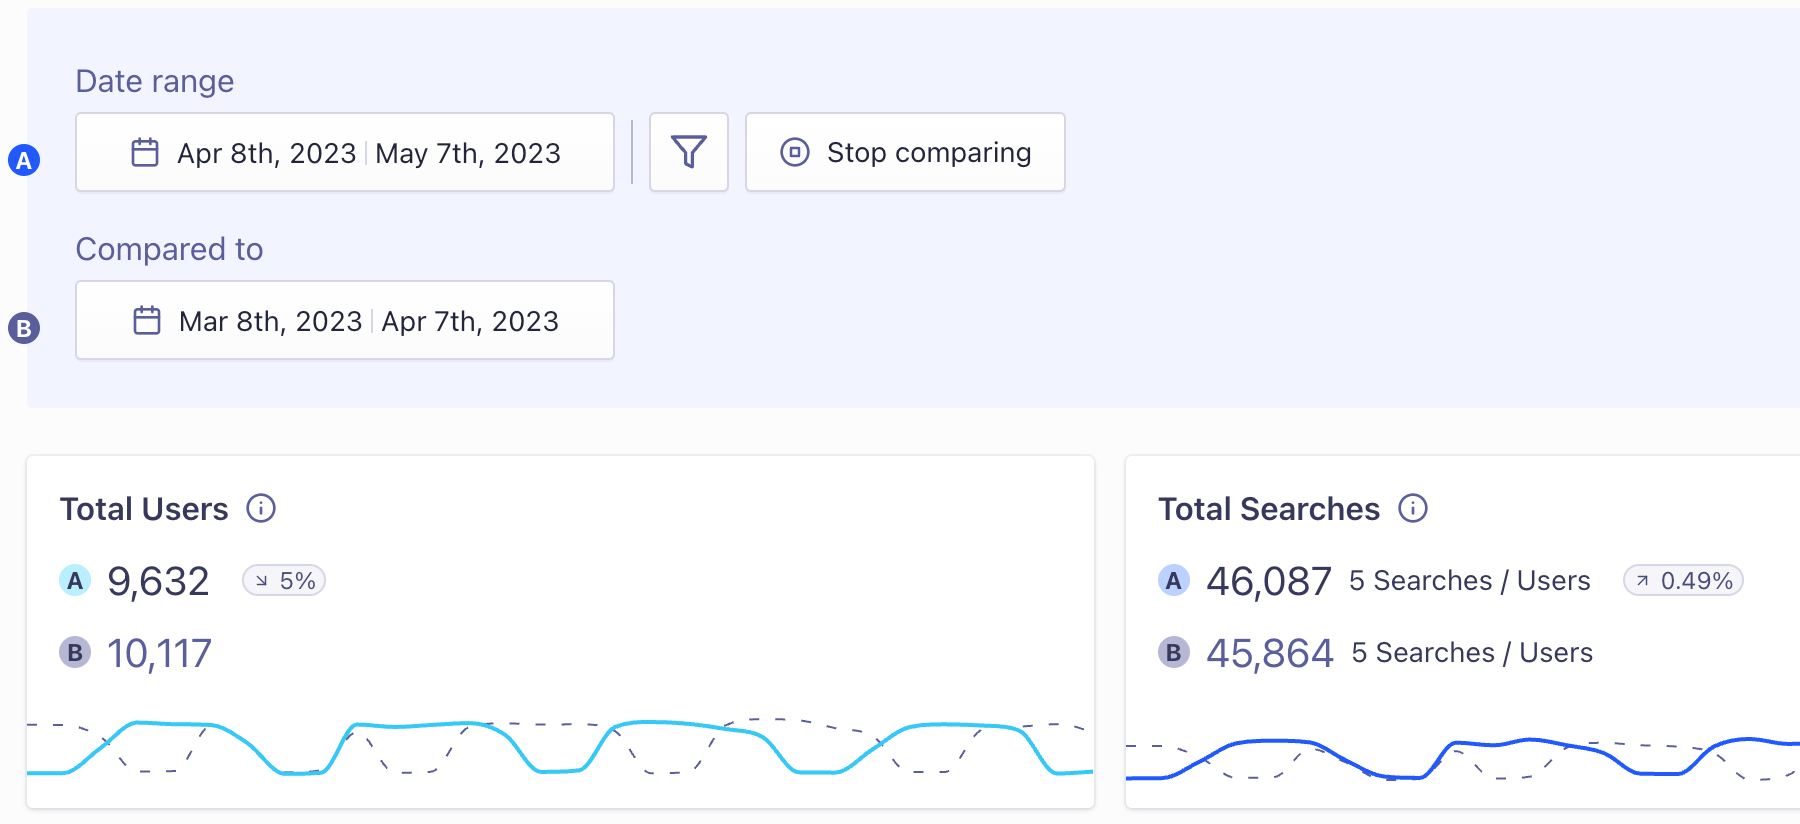
To compare the performance of your metrics between different periods, click Comparison mode and select the date ranges you want to compare.

The current date range is labeled A in the metrics graphs and uses a solid line. The comparison date range is labeled with B and uses dashes.
You can compare analytics from different days, weeks, months, or use custom time ranges.
Export analytics data
To export any of the metrics from the dashboard, click Download. You can export and download your analytics data as CSV or XLSX files.
Click, conversion, and revenue analytics
Some metrics, such as the conversion rate, need events from your app or website.
Graphs and tables that involve these metrics won’t display data until you start sending events.
Revenue analytics, including add-to-cart and purchase metrics are available on the Build, Premium, and Elevate pricing plans.
Integrate with Google Analytics
If you want to track your search performance with Google Analytics as well as Algolia Analytics, see Integrate Google Analytics.

