Get started using the Crawler Admin
The Crawler Admin is an interface for accessing, debugging, testing, configuring, and using your crawlers.
Admin layout
After logging into the Crawler Admin, select one of your crawlers or create a new one.
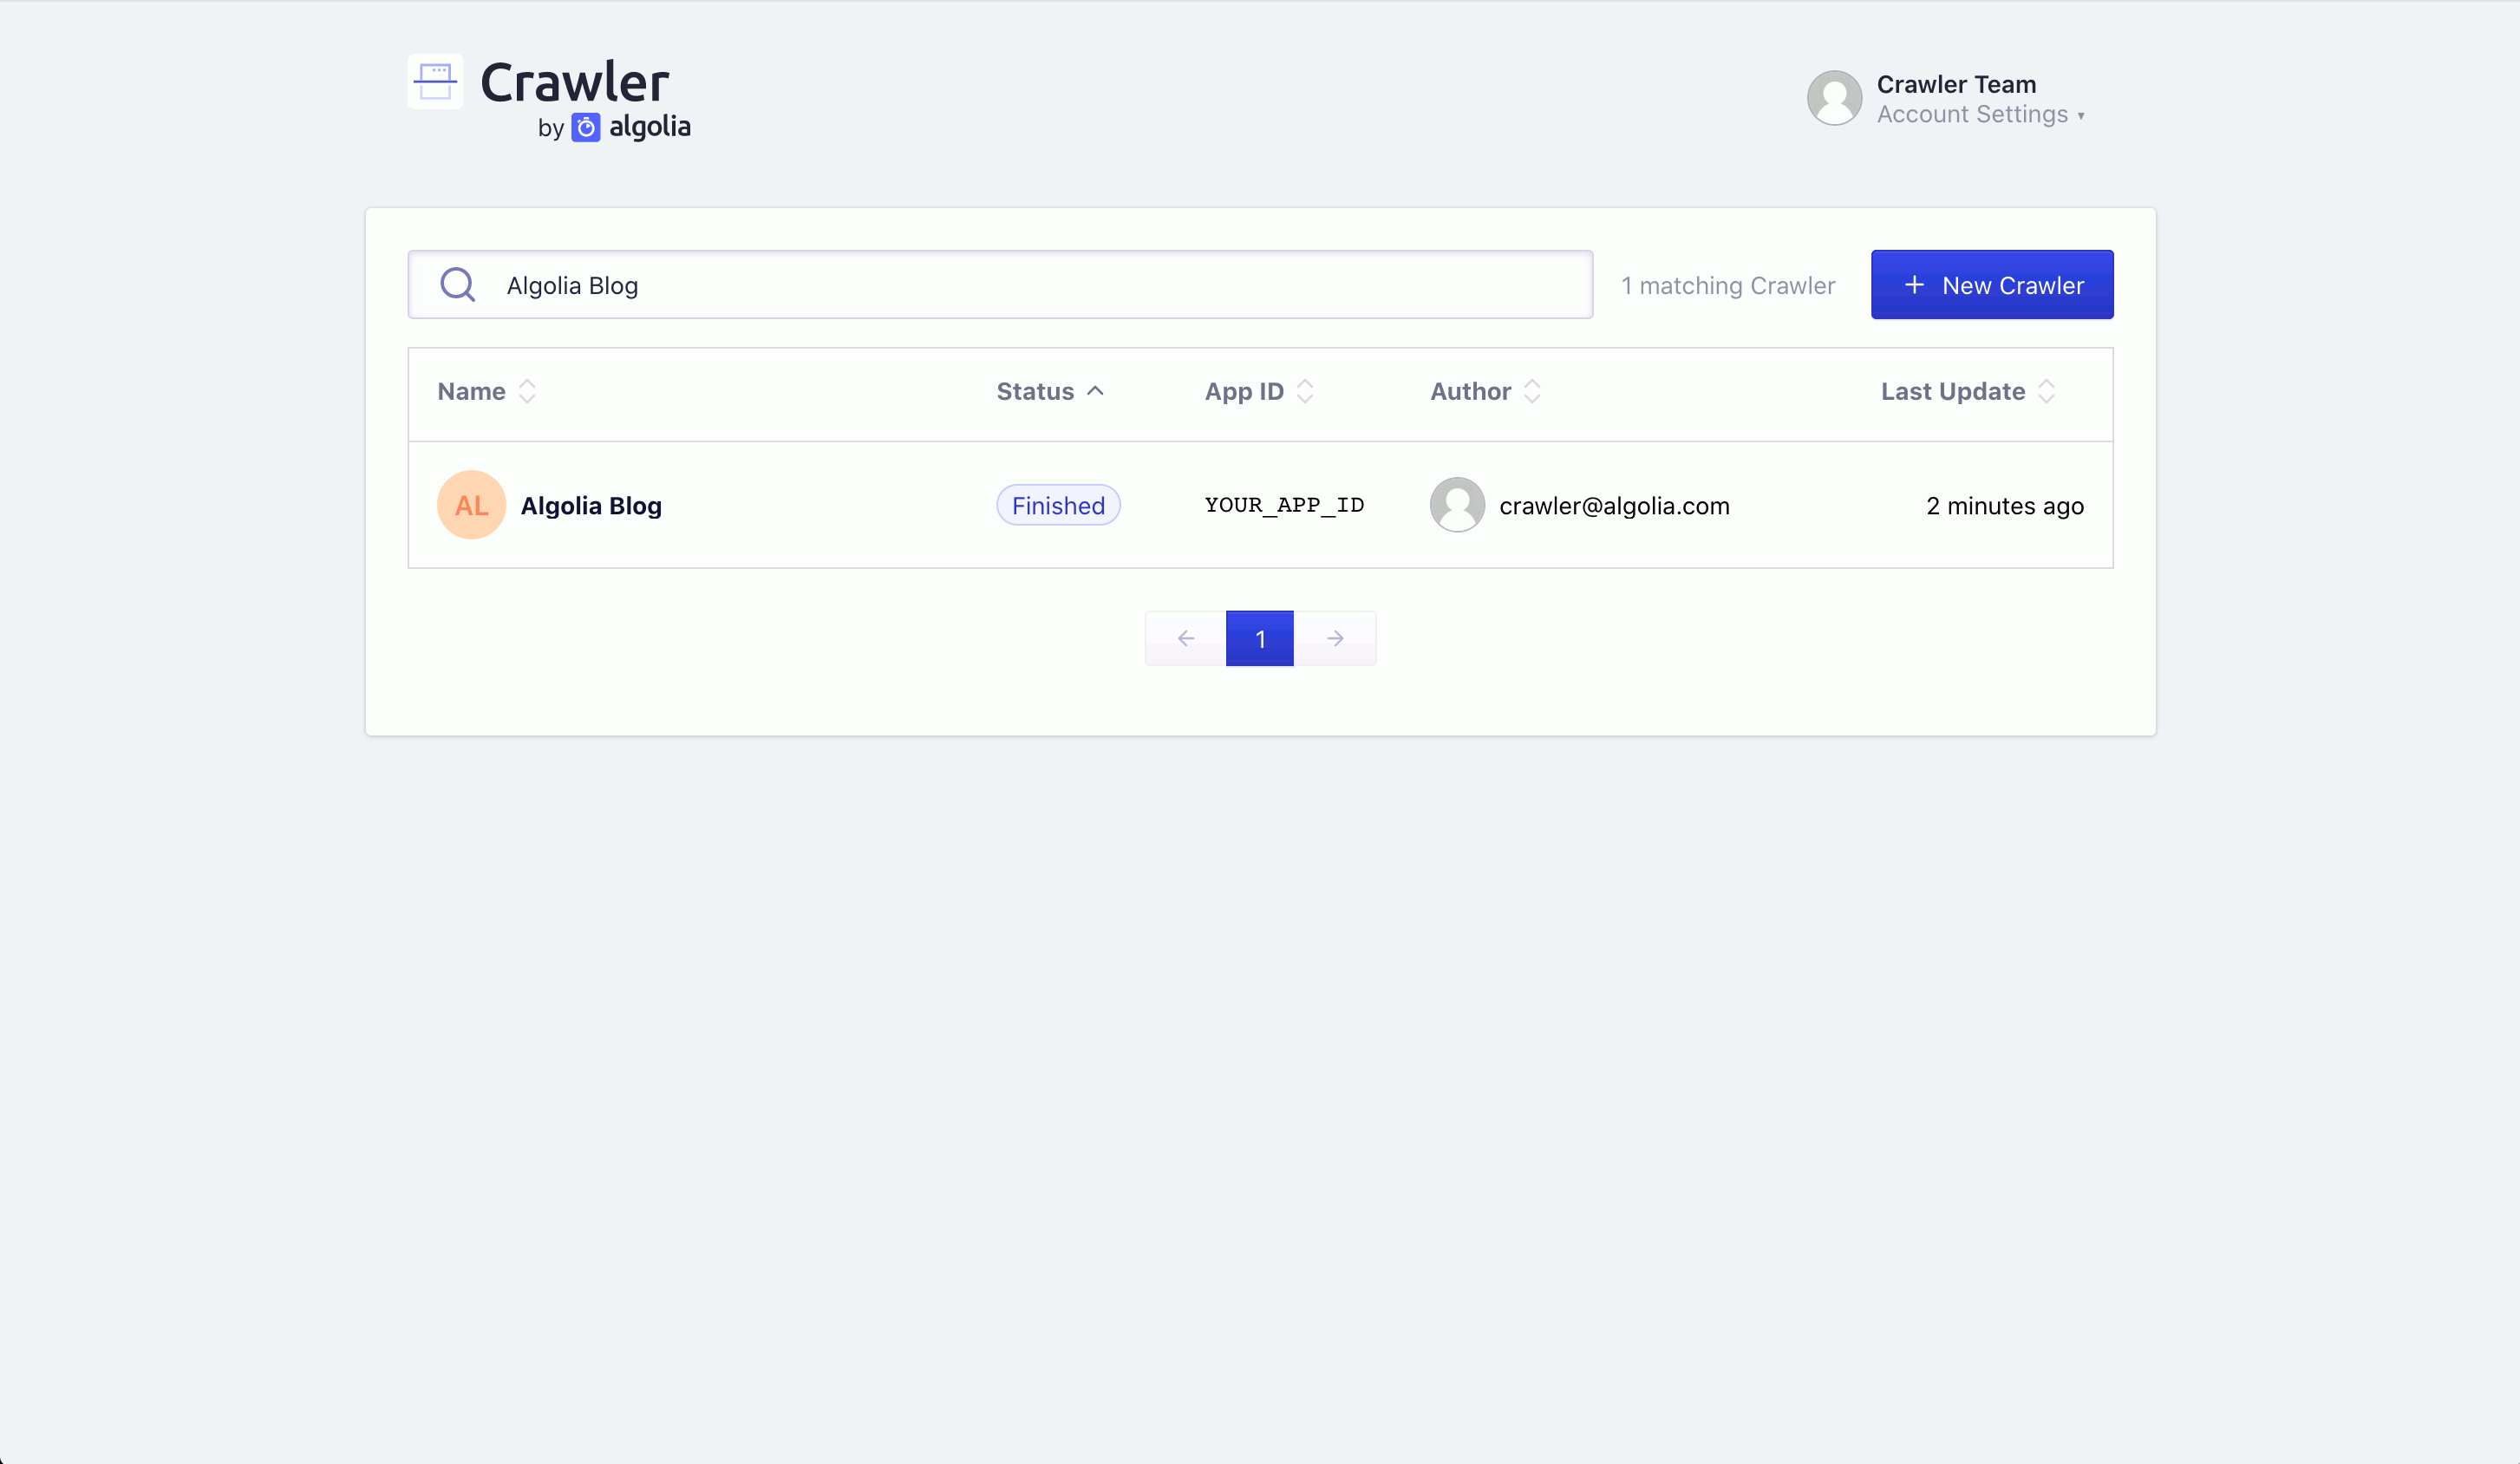
Select a crawler for an overview.
The sidebar menu
The menu has several options:
You can also use the sidebar to:
- Return to the Admin Crawler home page (to select a different crawler or make a new one),
- Read the Crawler documentation
- Send feedback to Algolia
- Ask for support
- Access your account settings.
Overview
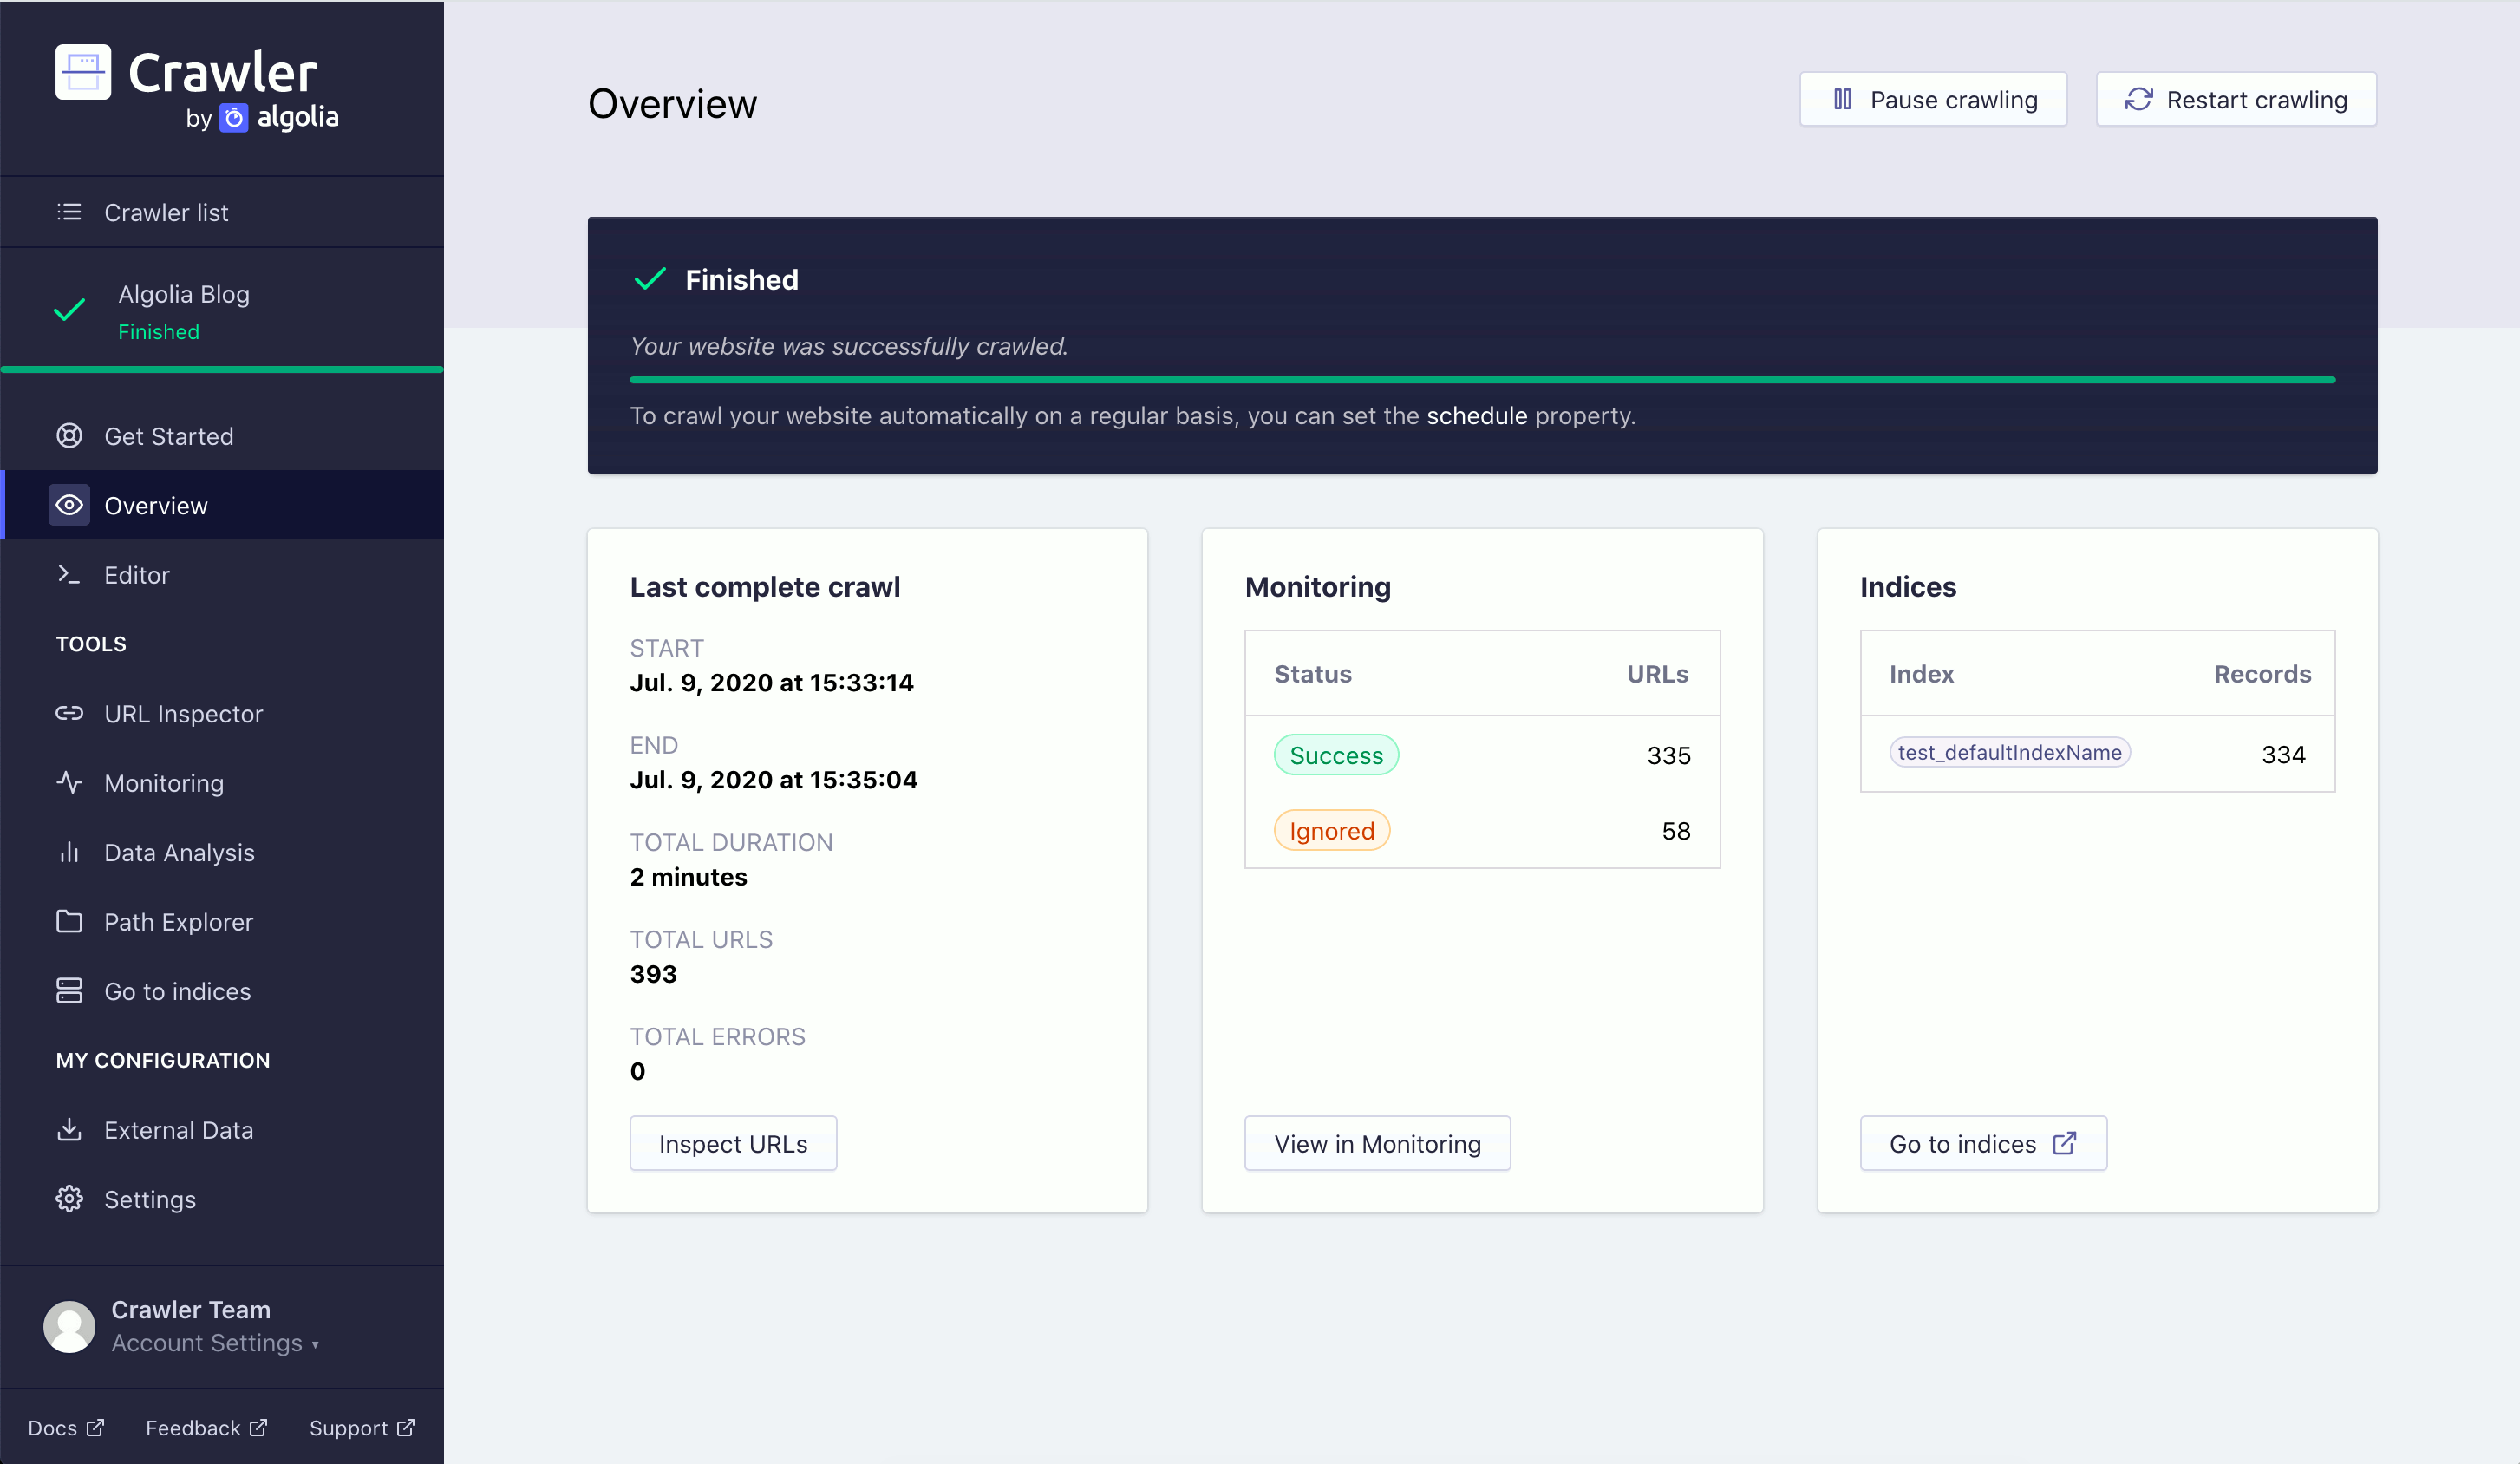
To start a crawl, click Restart crawling at the top of the Overview section.
The overview page contains a:
- Progress bar.
- High-level summary of your previous crawl.
- High-level monitoring overview of your previous crawl.
- List of your crawler indices.
Editor
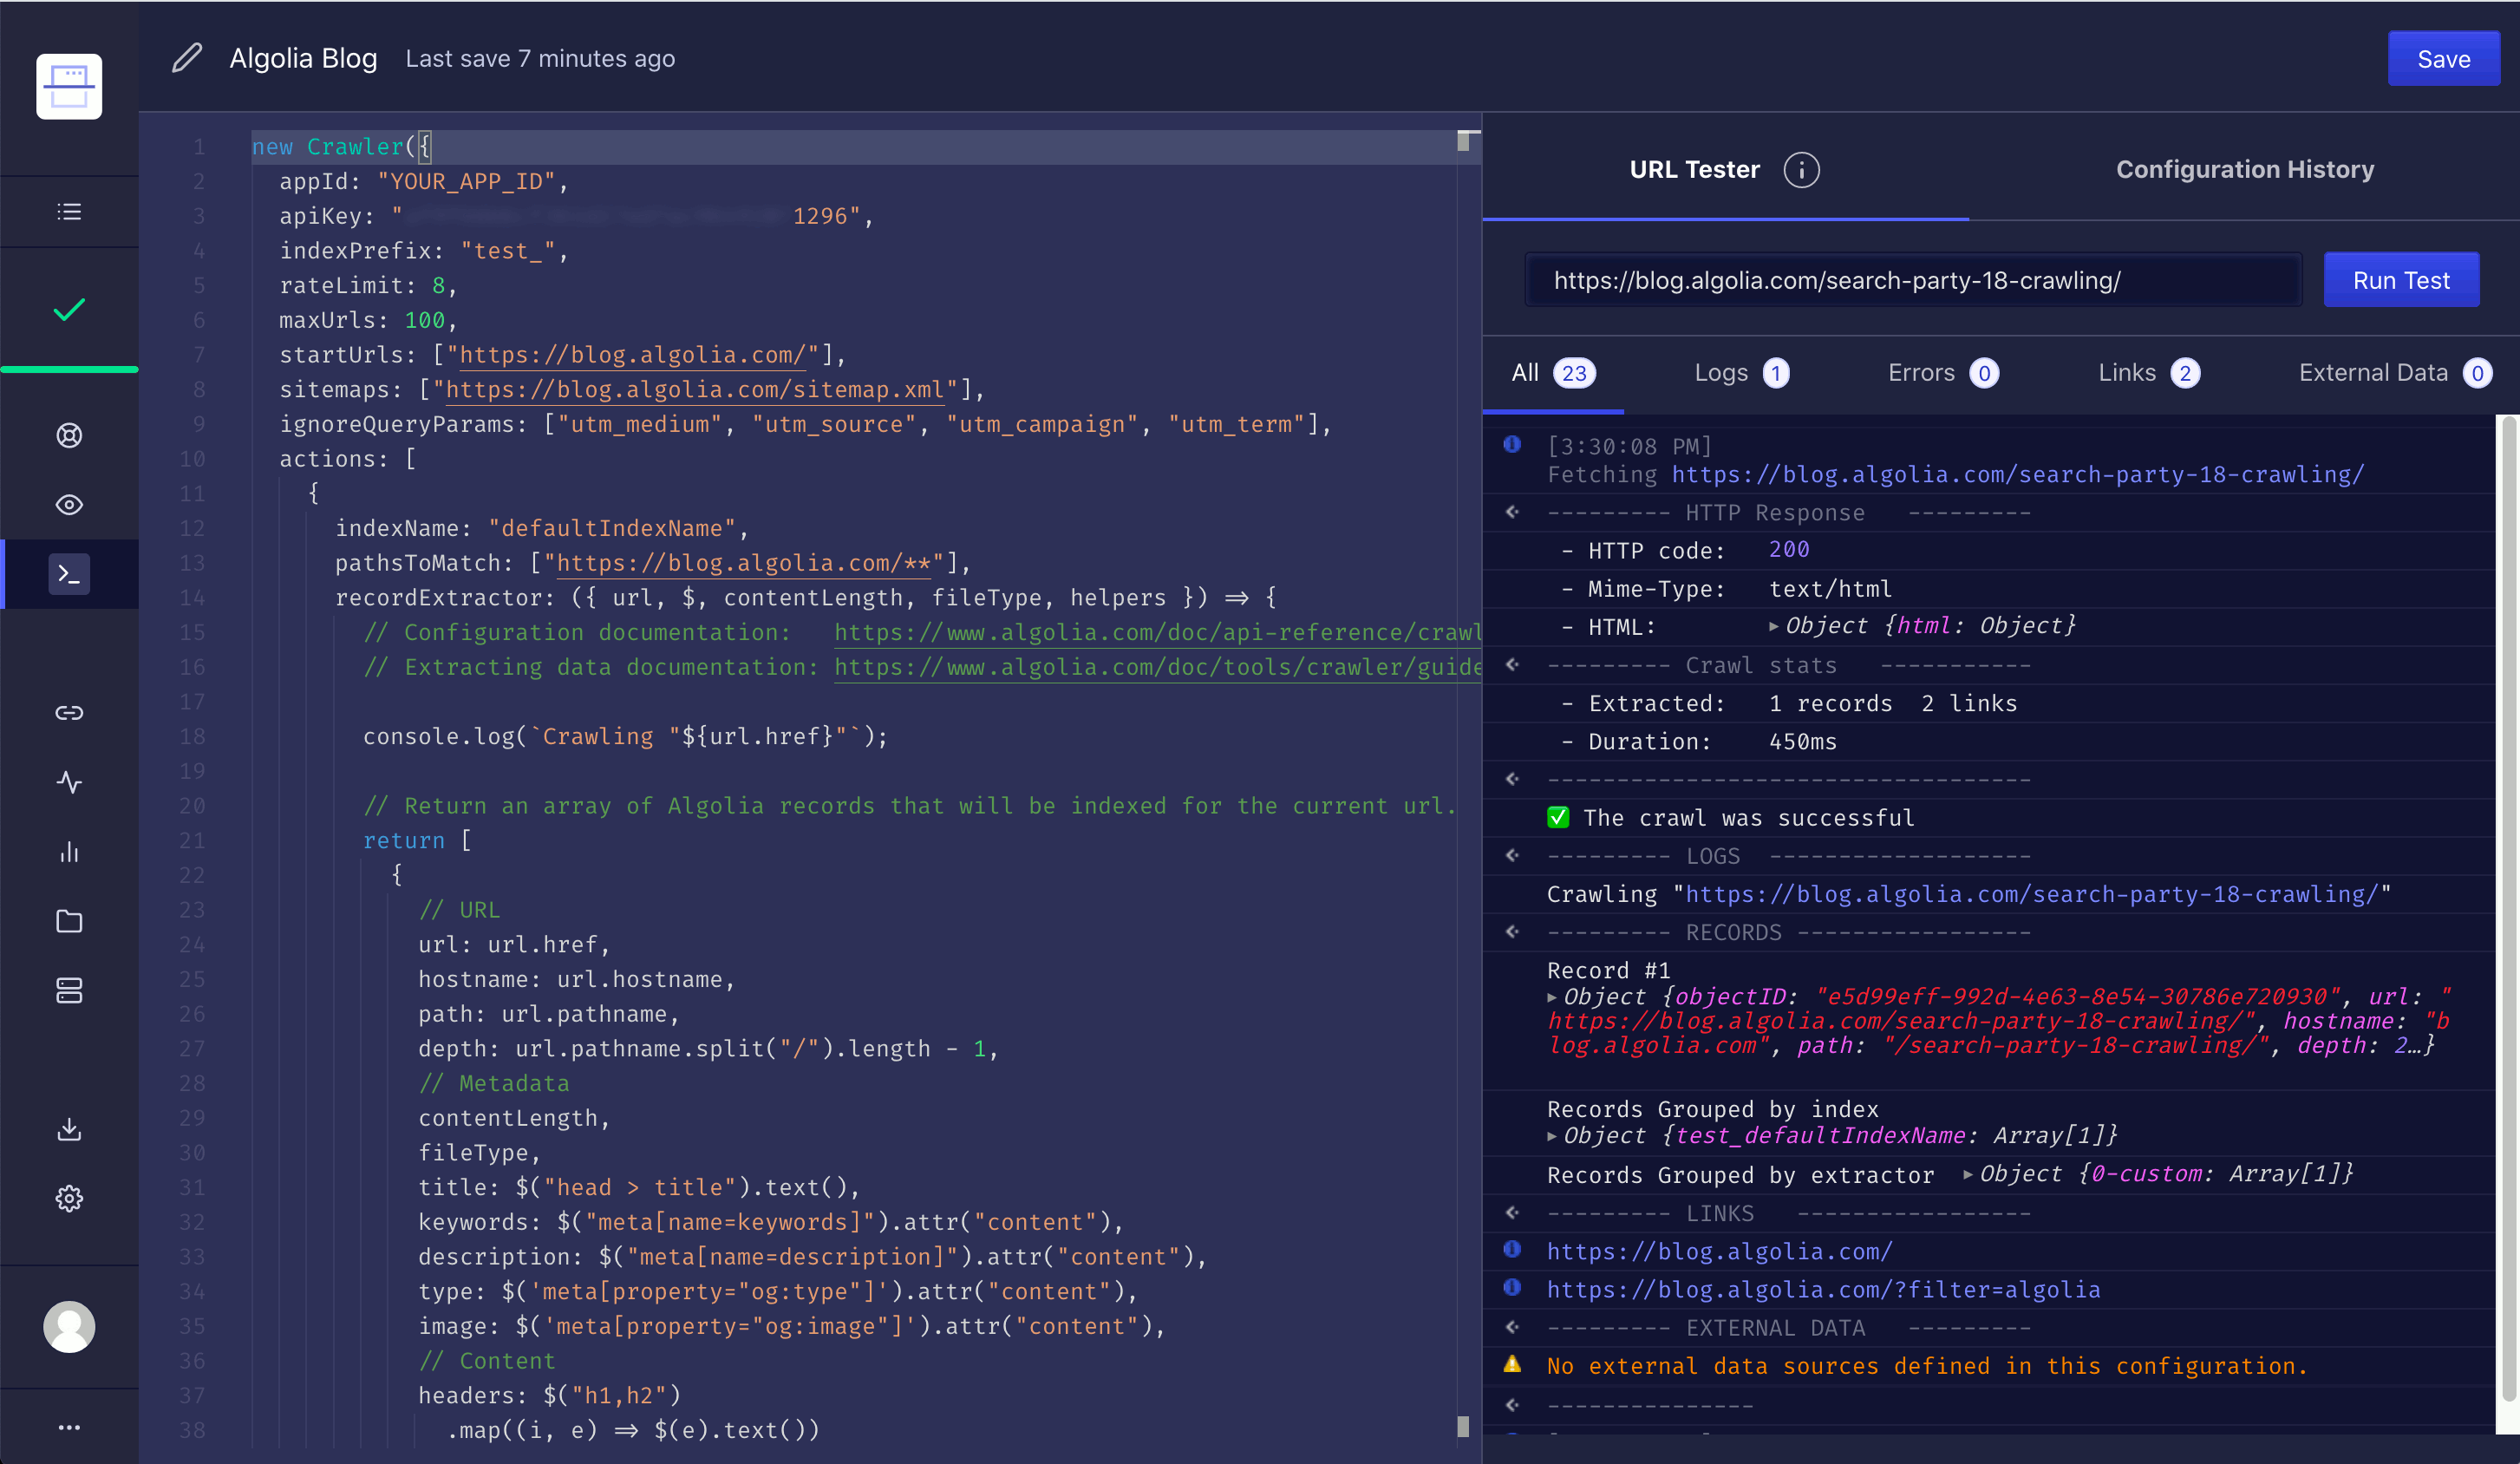
The Editor section lets you edit your crawler’s configuration.
To check that you’ve properly configured your crawler, enter a URL into Test URL and click Run Test. This gives a detailed overview of your crawler’s response to the specified page.
URL Inspector
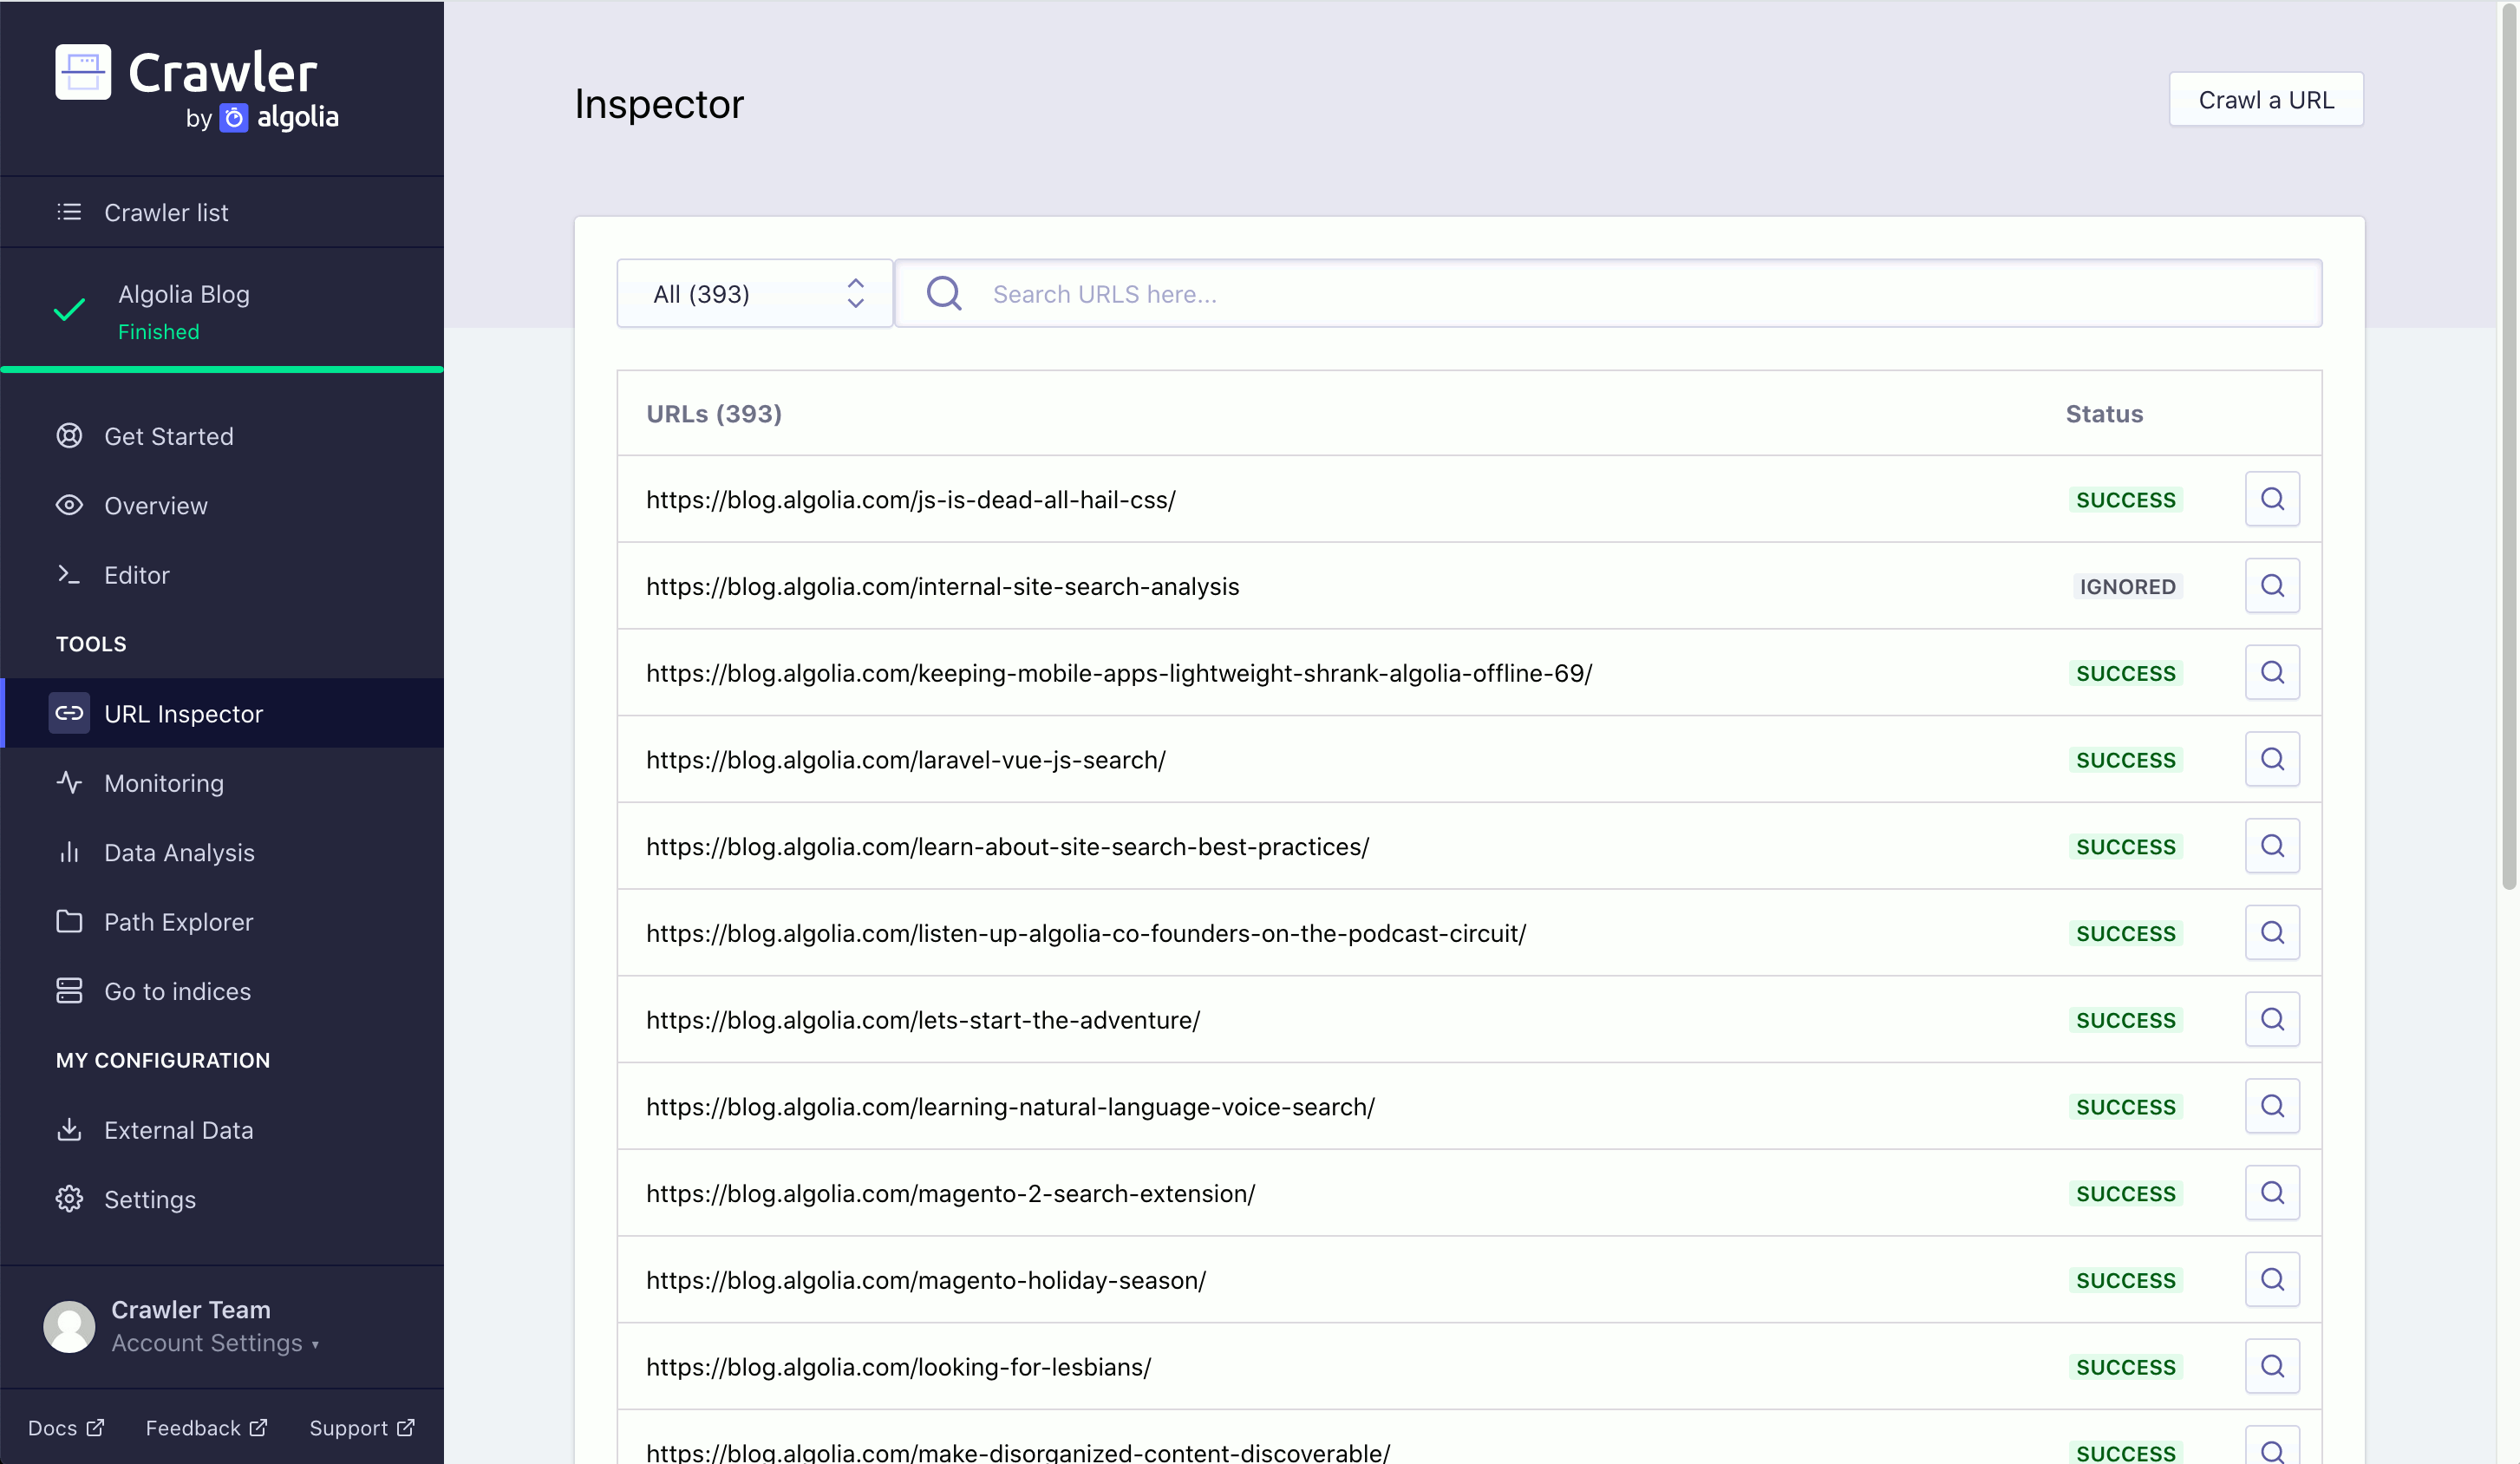
Use the URL Inspector to search through all the URLs you’ve crawled. On the main page, you can see whether a URL was crawled, ignored, or failed. Click the magnifying glass icon to see metadata and extraction details for the page.
Monitoring
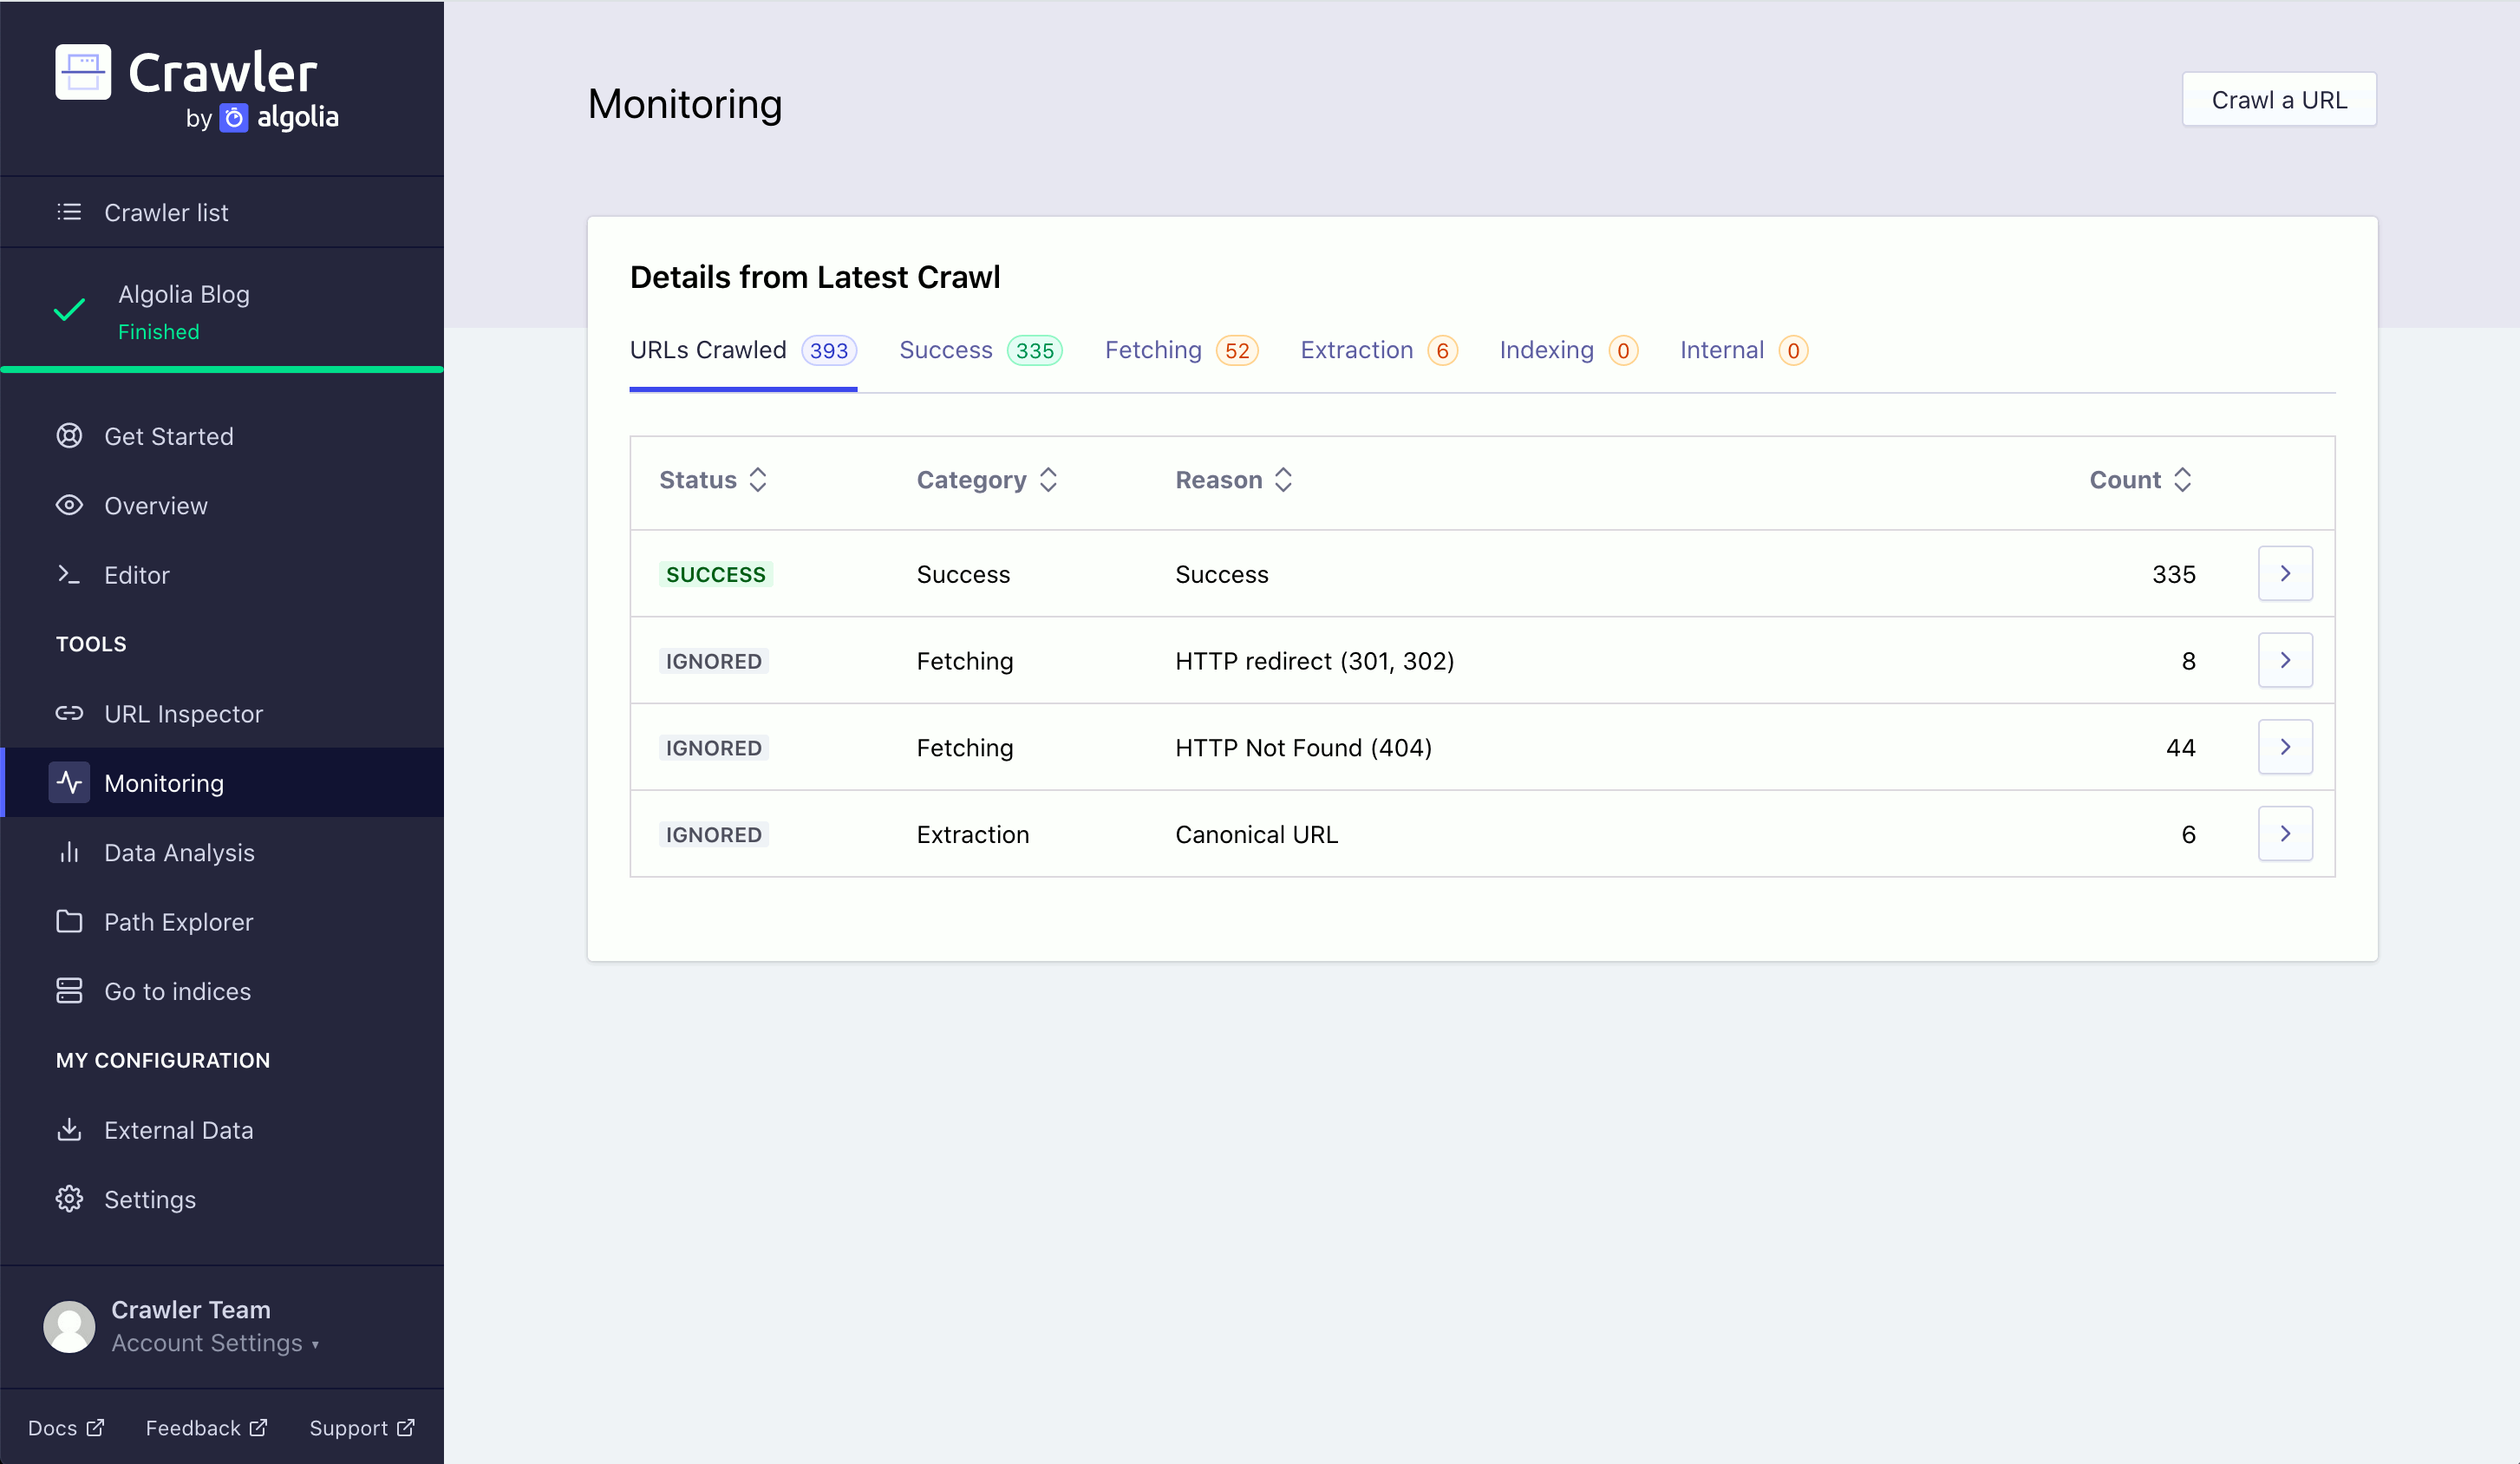
Use the Monitoring section to sort crawled URLs based on the result of their crawl. A crawled URL has one of three statuses: success, ignored, or failed. Each URL has one of five categories:
- success
- fetch error
- extraction error
- indexing error
- internal error
You can filter your crawled URLs on these categories, using the options beneath Details from Latest Crawl. Each URL gives a reason for any error.
View all URLs associated with a particular reason by clicking on any value in the reason column.
Click the number in the pages affected column to view a list of the affected URLs for a specific row.
Data Analysis
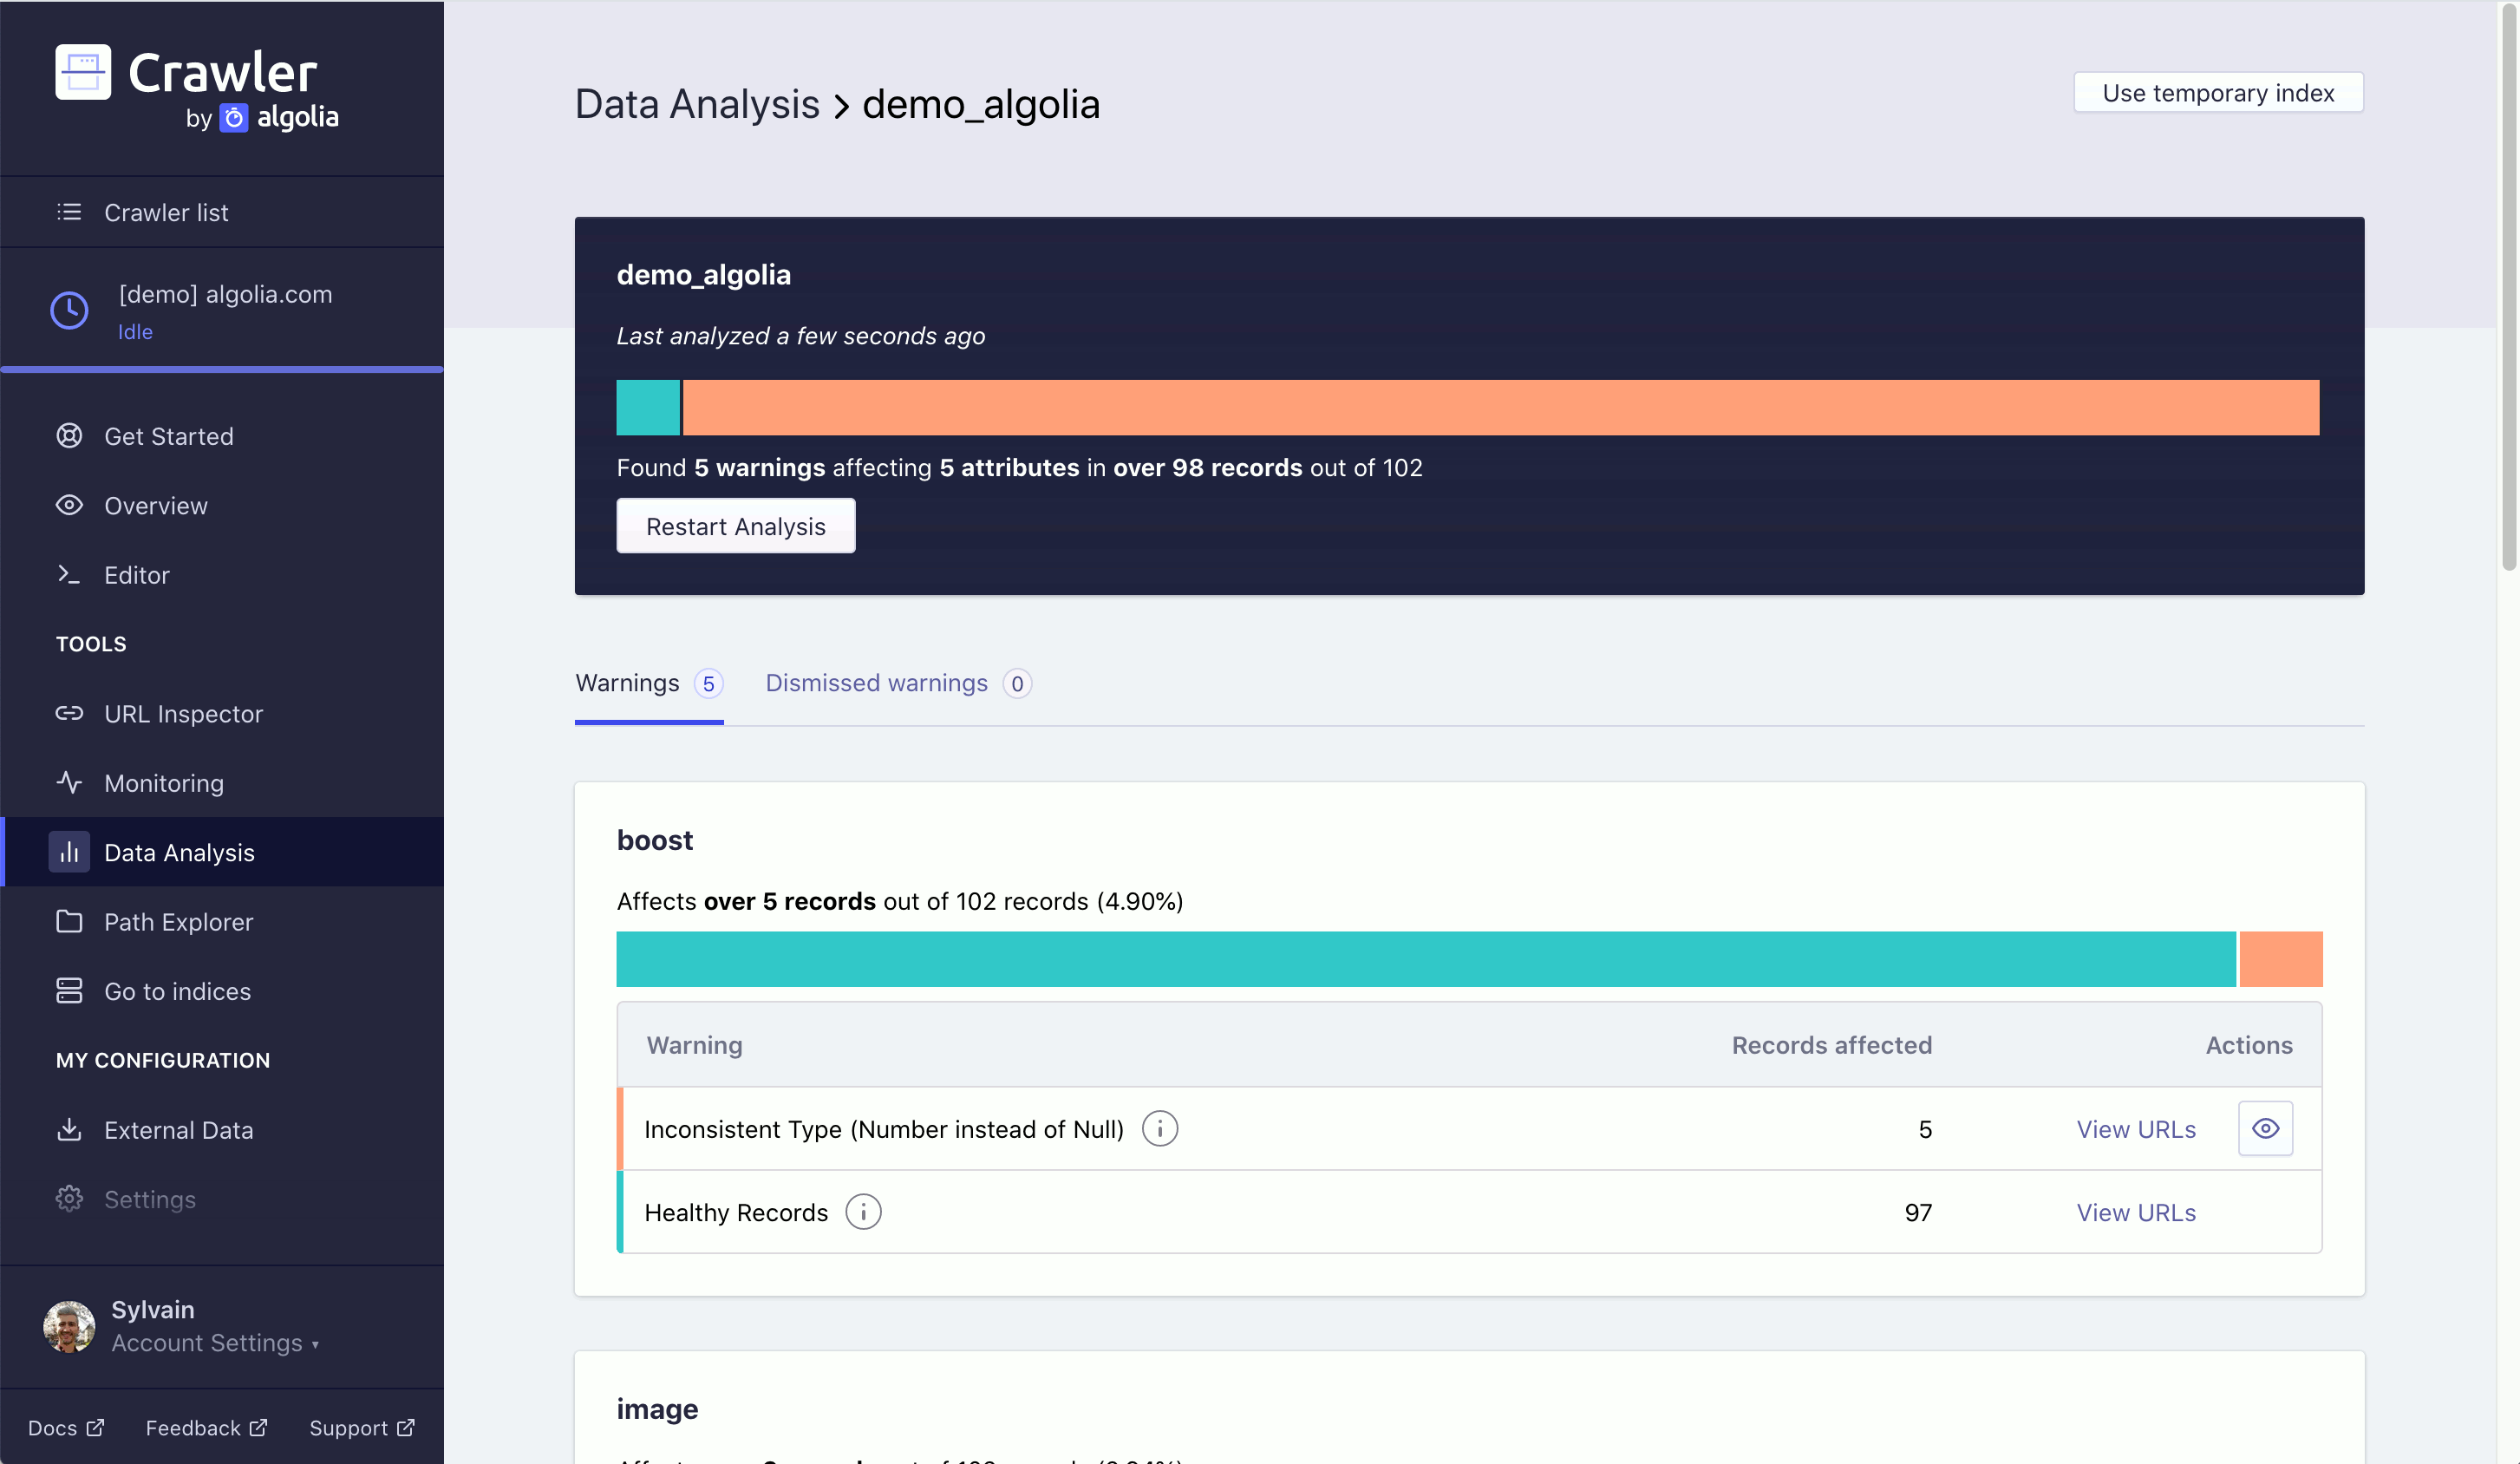
Use the Data Analysis section to test the quality of your crawler-generated index. Click on Analyze Index for an index to examine the completeness of your records. It lets you know if any records are missing attributes, along with the associated URLs.
This can be an effective way of debugging your indices.
Path Explorer
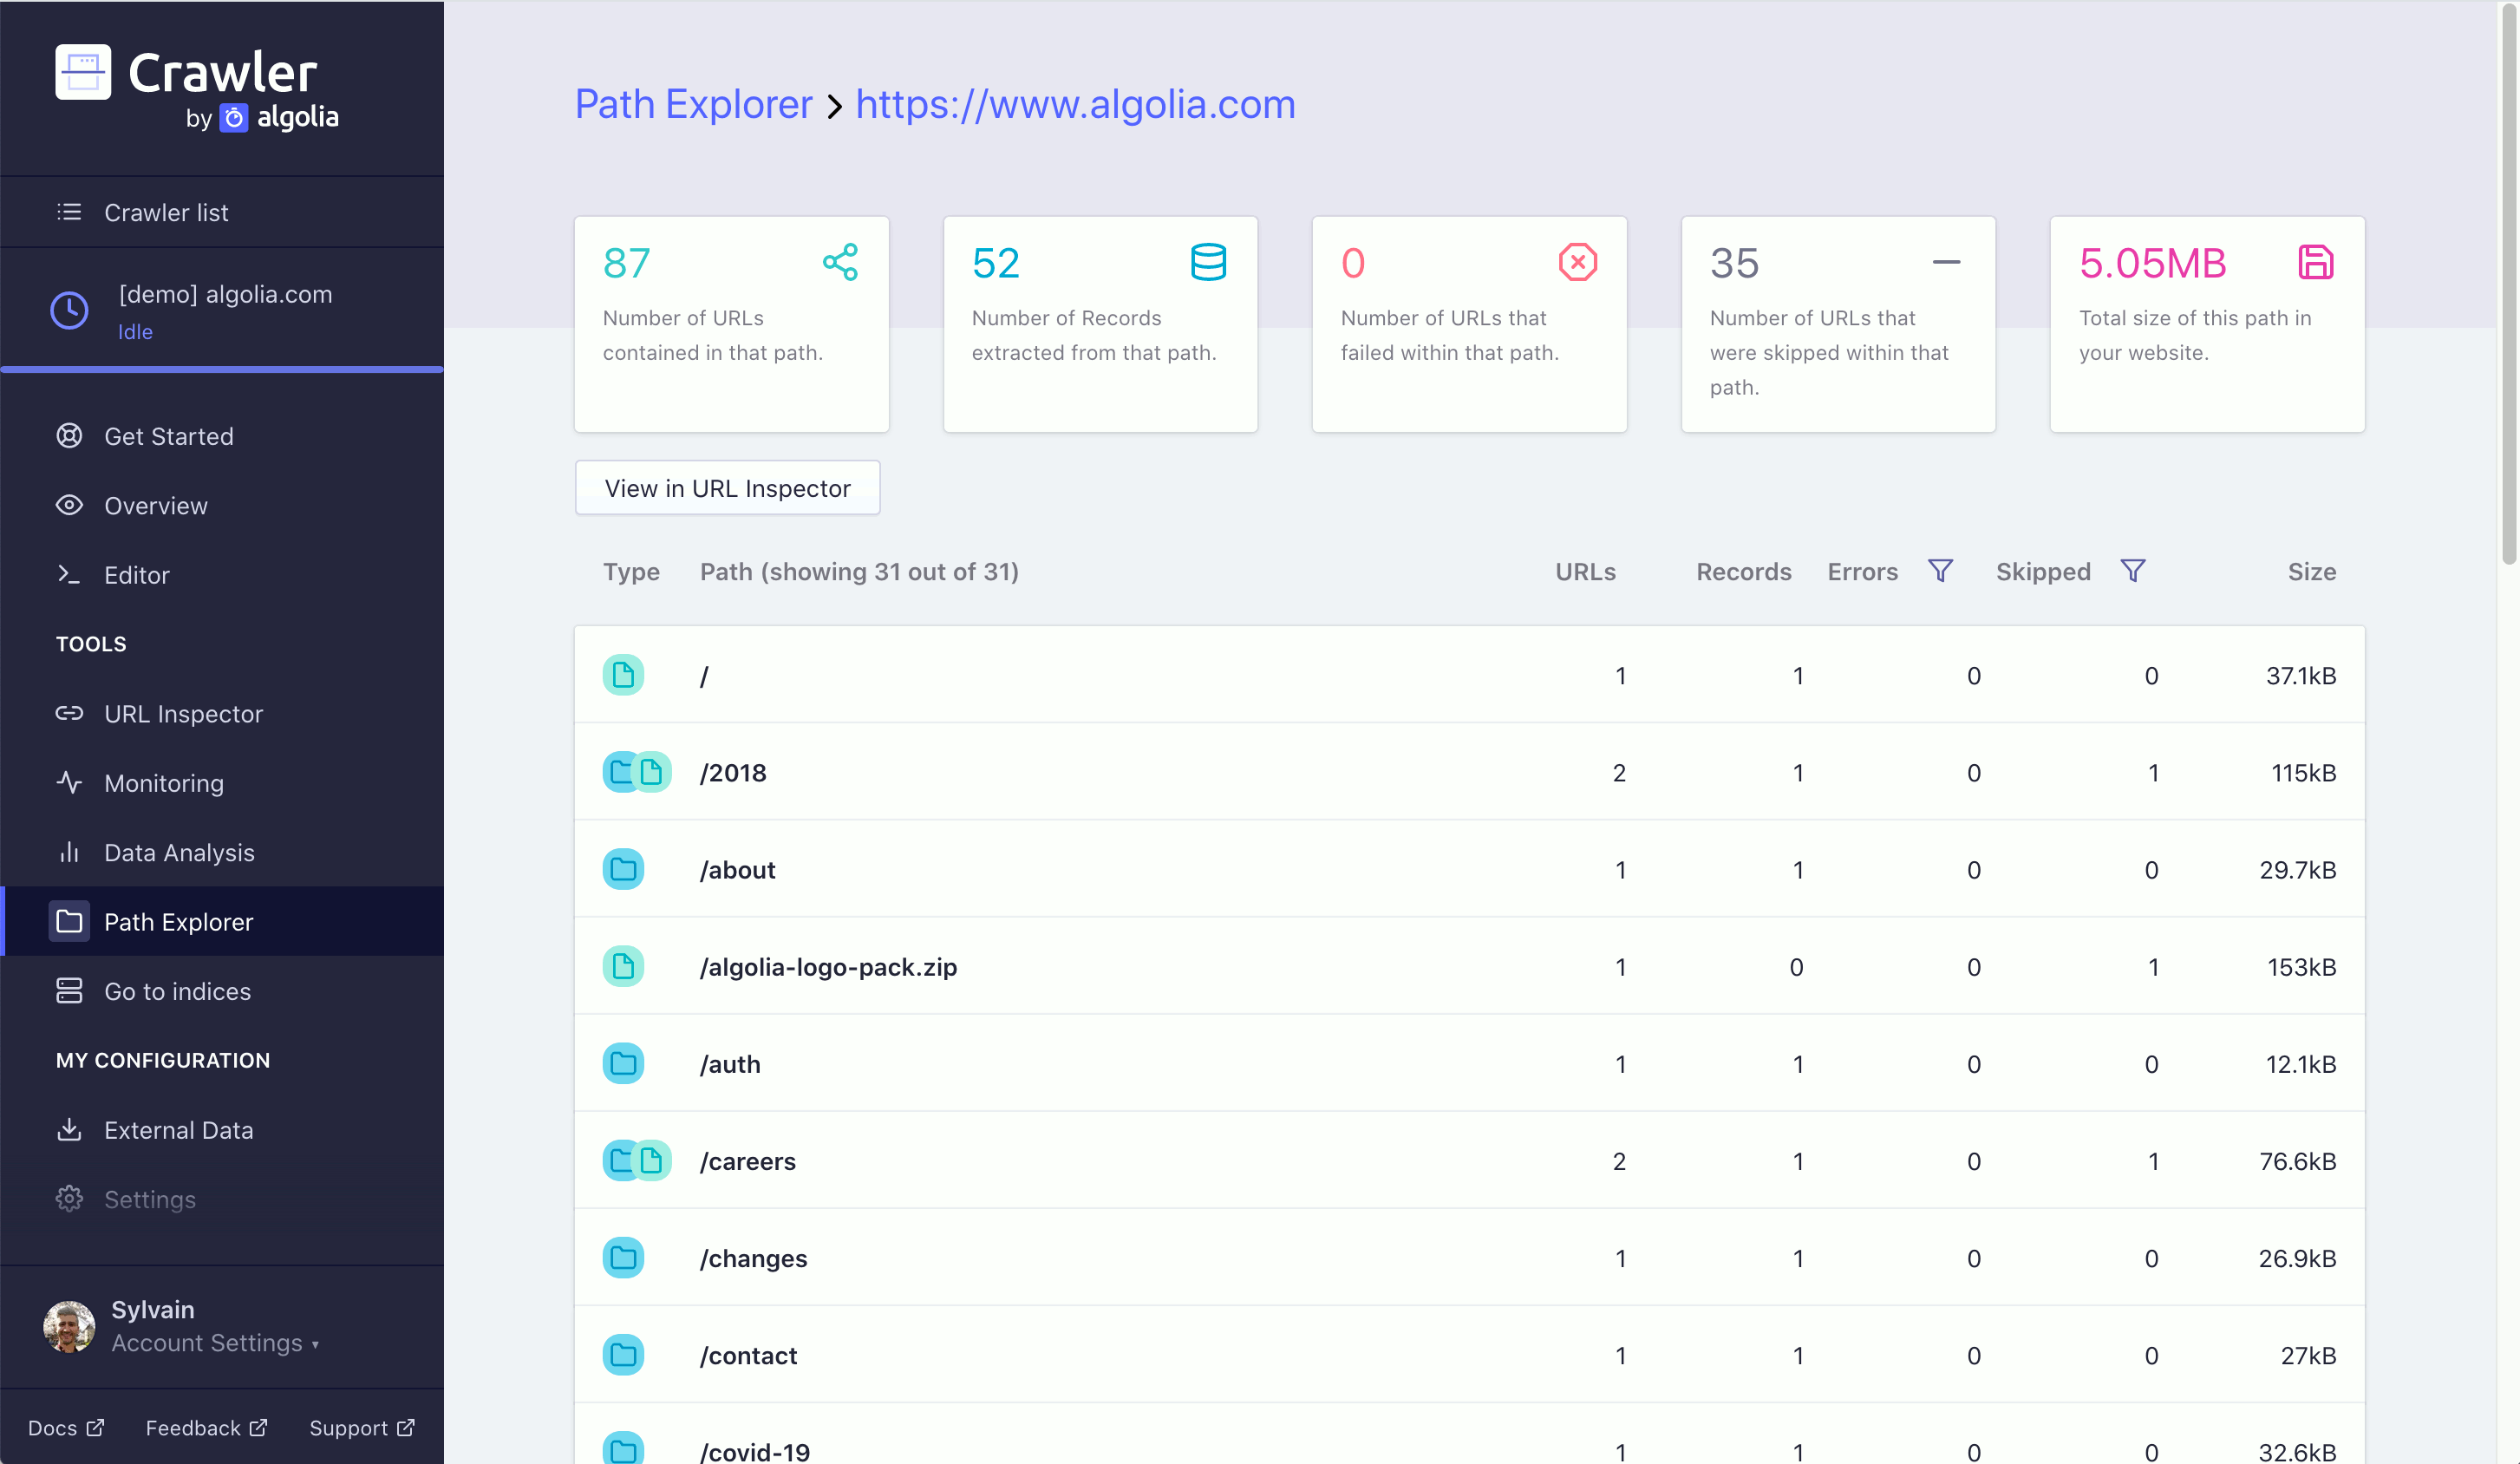
In the Path Explorer, your crawled URLs are organized in a directory.
The root folders are defined by your startUrls.
The URL path of your current folder is shown in the Path Explorer area.
- Folders are represented by blue circles with folder icons: click them to open a sub-directory and append the folder’s name to your URL path. = - Files are represented by green circles with file icons: they take you to the URL inspector for the current path with the clicked file’s name appended.
The / file is the page associated with the current Path Explorer URL.
External Data
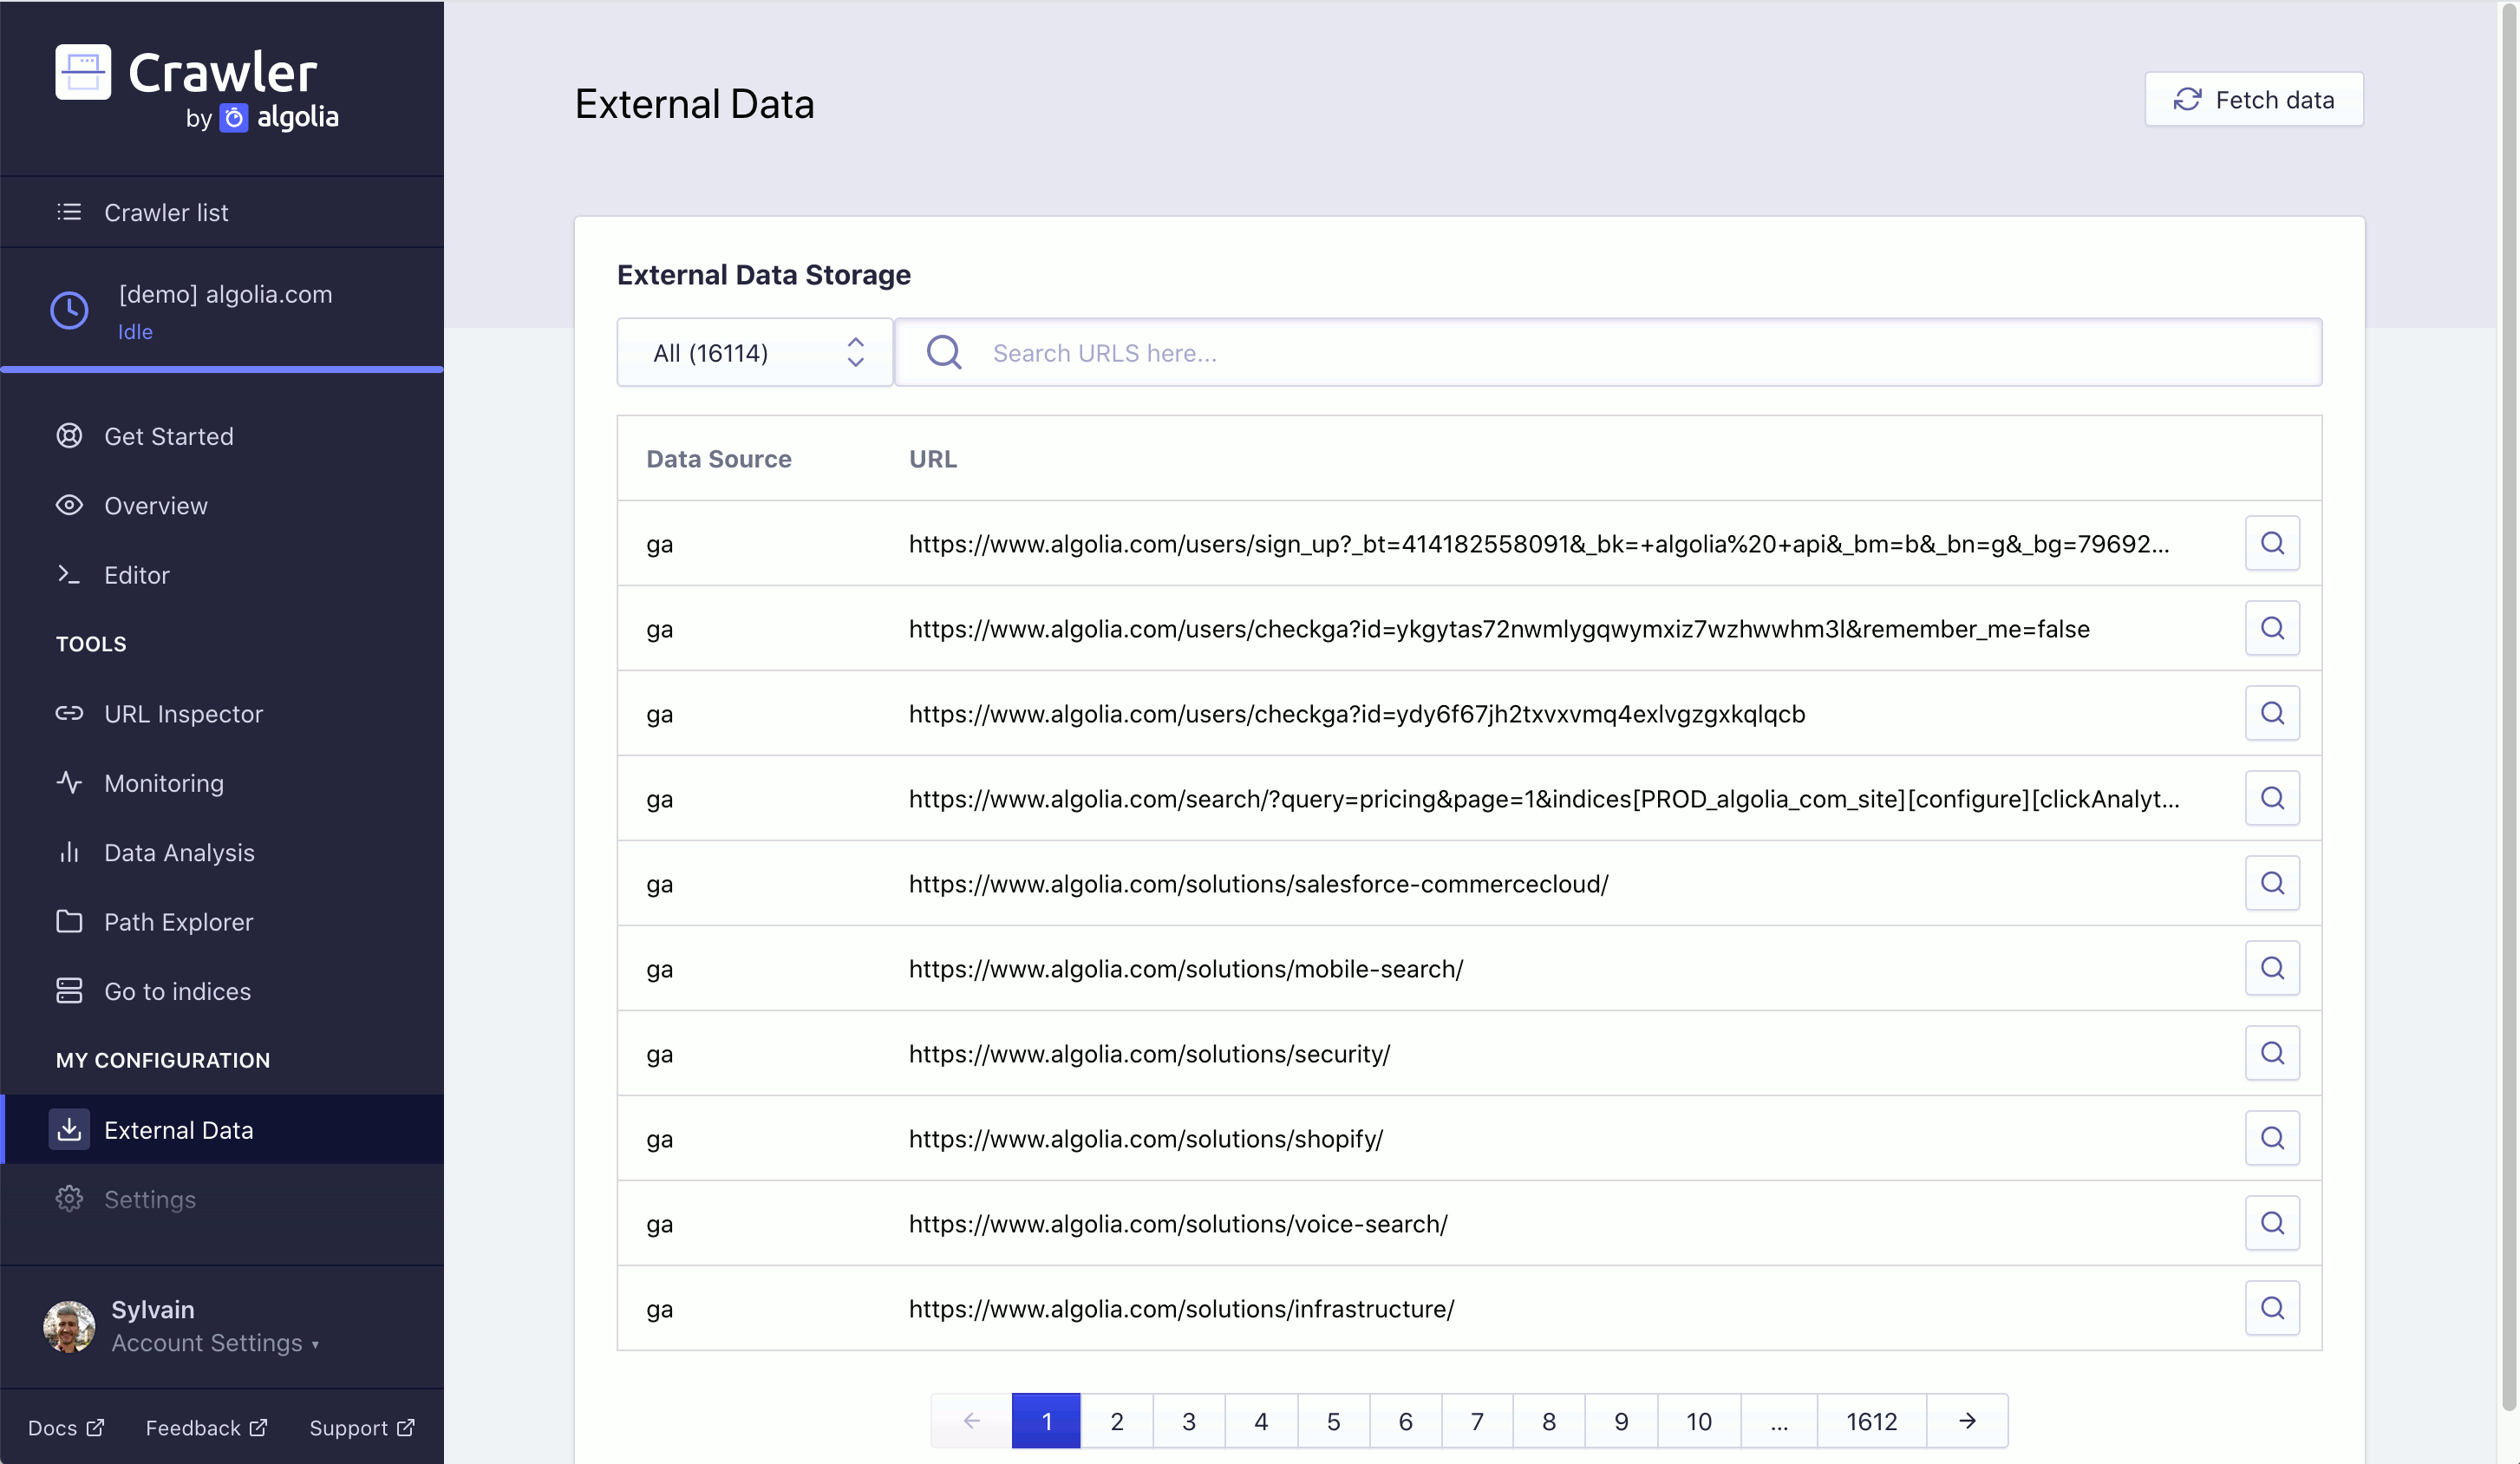
Use the External Data section to view the external data passed to each of your crawled URLs. Click the magnifying glass icon for a specific URL to visit a page and its associated external data.
Settings
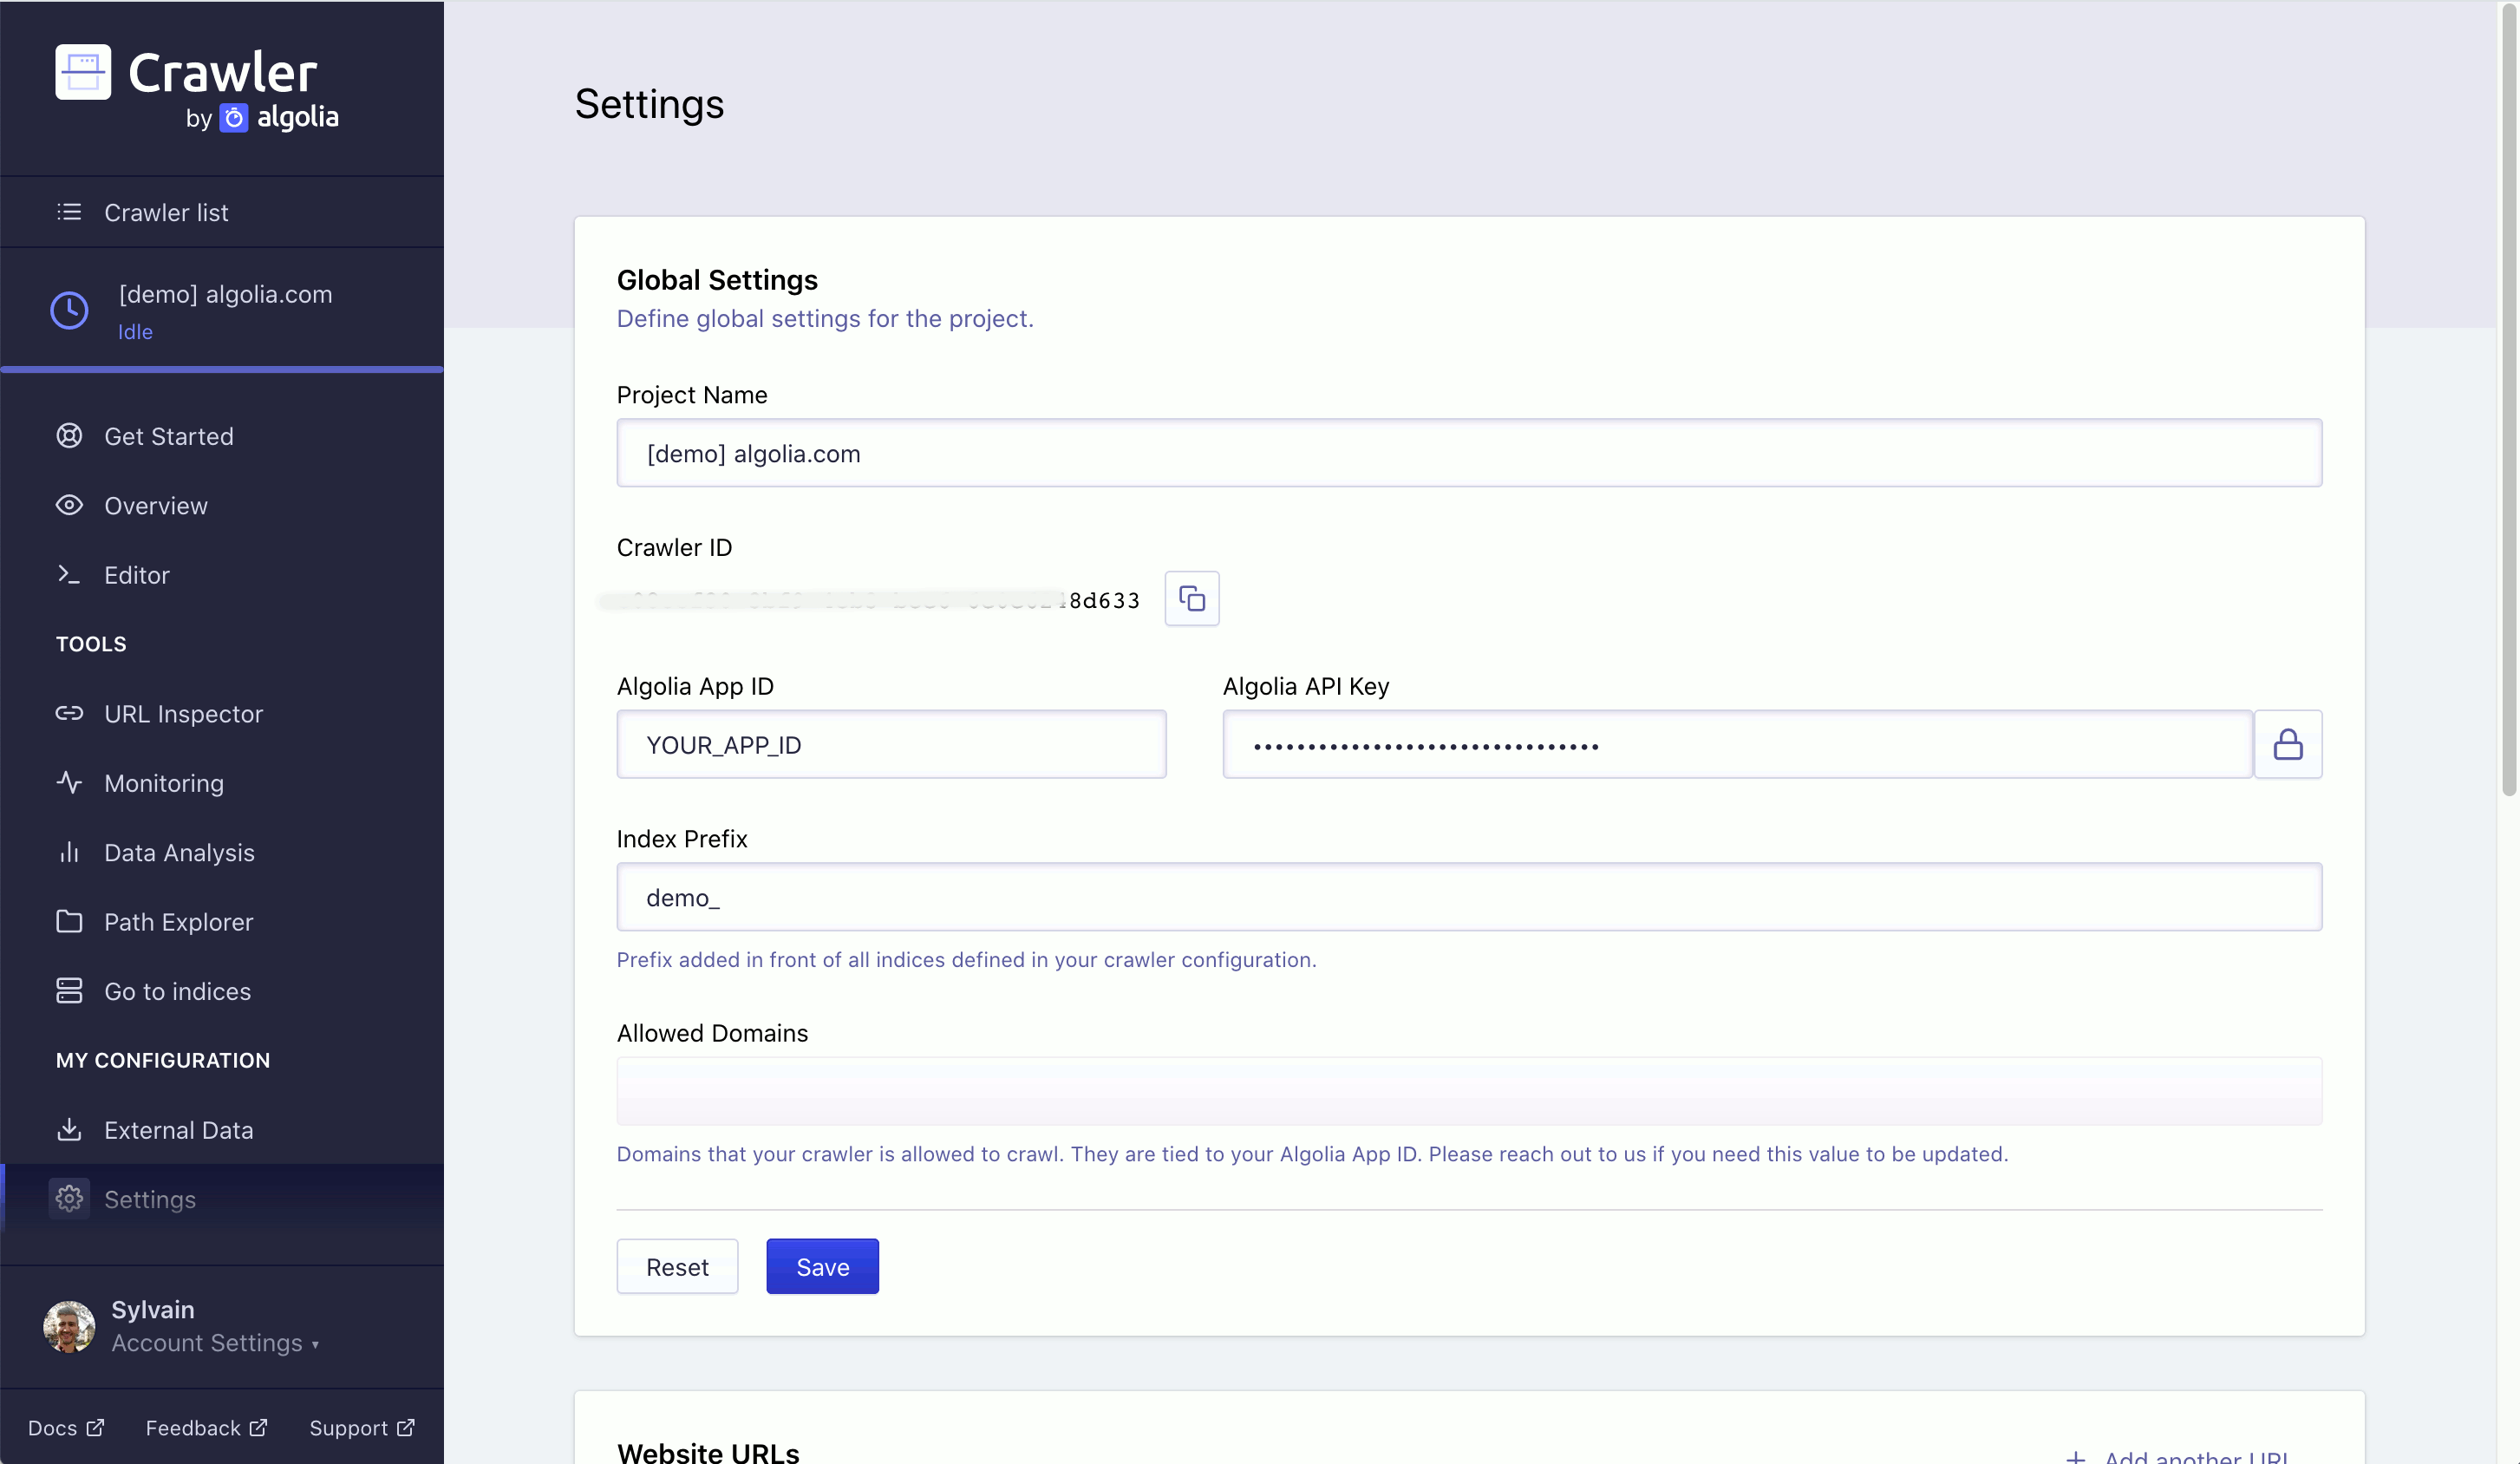
Use the Settings section to specify your crawler’s settings. You can edit:
- Global Settings: your project’s name,
CrawlerID, Algolia App ID, Algolia API key, and yourindexPrefix. These were set when you created your crawler. - Website Settings: set your
startUrls(creating a crawler should set a default value, but you can add more start points). - Exclusions: set your
exclusionPatterns(which URL paths you want your crawler to ignore).
