Data Analysis
Having consistent data is critical to creating a great search experience. For instance, when you’re using a particular attribute for ranking, but some of your records are missing that attribute, they might rank much lower than other records or even not appear in results.
Another use case is when you have inconsistent data types. If a price attribute is sometimes stored as text, sometimes as a number, Algolia can’t properly leverage it for ranking. This can lead to confusion and lost conversion opportunities.
These issues don’t happen often with well-structured and consistent sources such as a database. However, this can be a serious challenge when dealing with a website: when defining what to extract, you usually assess the general structure from a small sample of pages, and write extracting code based on these assumptions. However, some pages may have a different layout, resulting in inconsistencies in the extracted data.
The Data Analysis tool lets you find structural discrepancies within your indices, and warns you about possible issues in your data that you might not be aware of. The goal is to help you provide your users with the best search possible.
What can Data Analysis do?
Data Analysis can detect the following kinds of issues:
- Missing attributes
- Empty arrays
- Attributes with different types across records
- Arrays with elements of different types, even within a single record
- Suspicious objects that could be of another type, like a string that was used as an object
Data Analysis generates a report with an overview of how many records are affected by structural issues. It provides you with detailed information for each inconsistent record attribute, and a list of pages where inconsistencies were observed.
Index summary
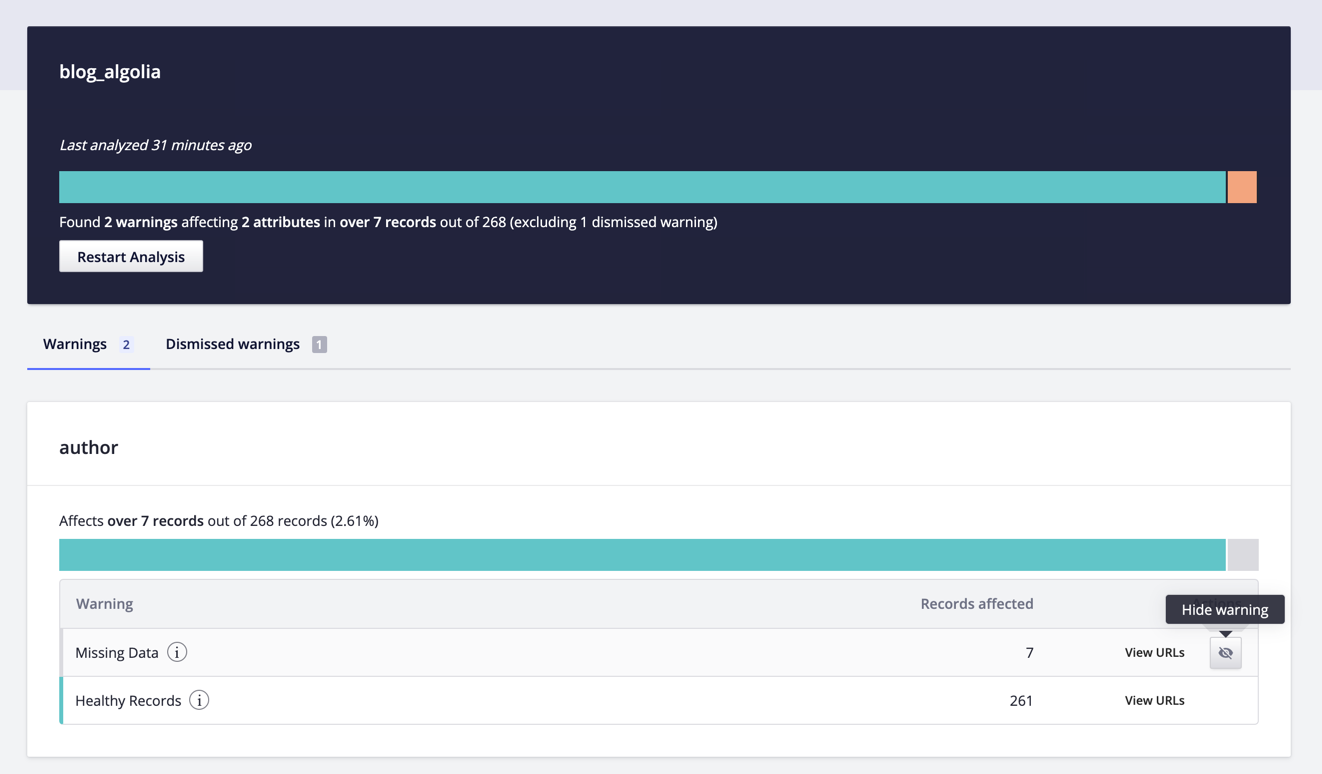
The index summary component describes the complete analysis of your index. If you haven’t run an analysis yet, you can start one by clicking on the Analyze Index button. Once the analysis is complete, the component should look like this:

The bar displays the ratio between healthy and problematic records, as well as a summary that explains how many warnings were found. If your data has changed since the last analysis, you can click on Restart Analysis to update your results.
Attribute warnings
Below the index summary, you can find the attribute warnings cards. They each compile all the warnings for a given attribute.
In this example, we have two warnings affecting the rating attribute. We can investigate them thanks to the provided information.

We show two different colors for the warnings: grey warnings are about missing data, while orange warnings are about type inconsistencies.
Clicking the View URLs button shows a list of URLs with the issue. You can test each URL in the Editor by clicking their Test URL button. You can also visit the page in your browser to investigate further.
Managing warnings
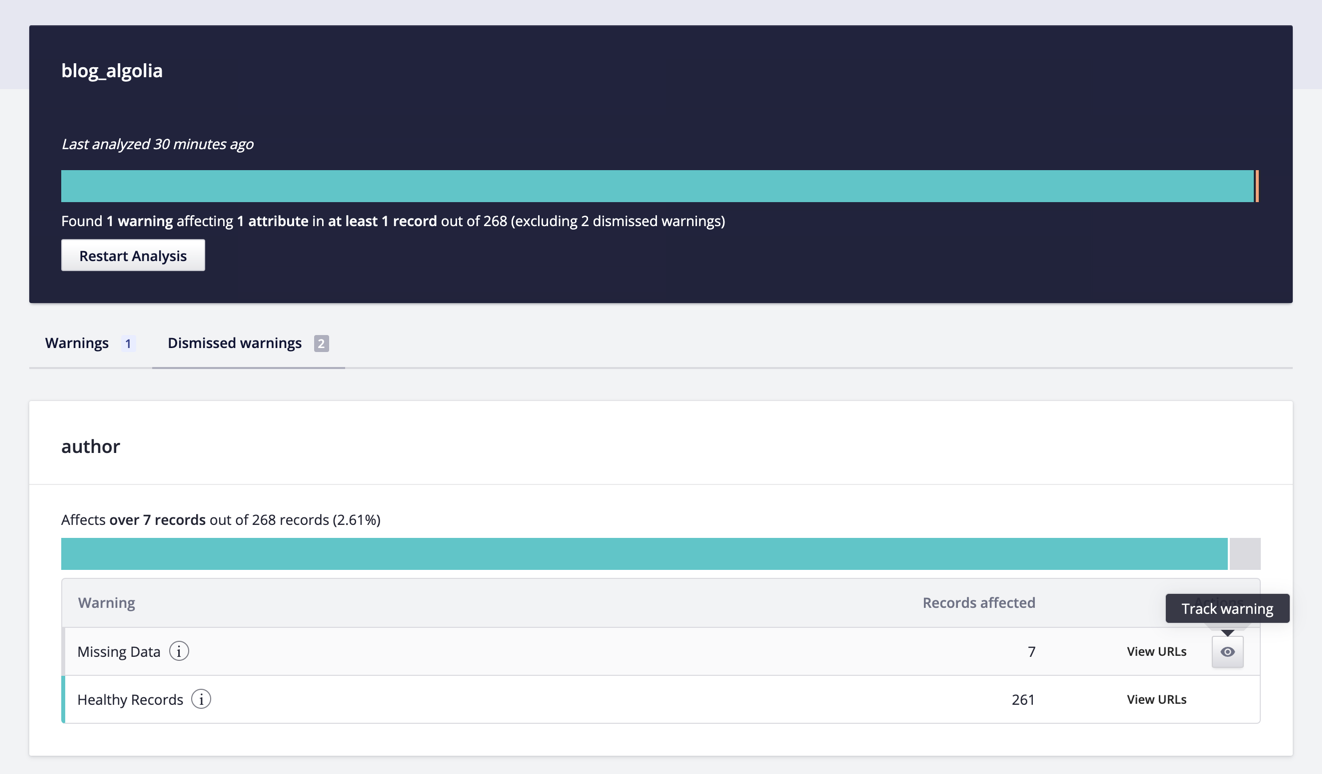
While investigating certain issues, you may consider some warnings as expected. To ignore them in future tests, you can click the Hide warning icon. You can restore any warning from the Dismissed warnings tab.

When you dismiss a warning, it updates the index summary display. You can find the warning back in the Dismissed warnings tab, and restore them if you want.

